QUESTION IMAGE
Question
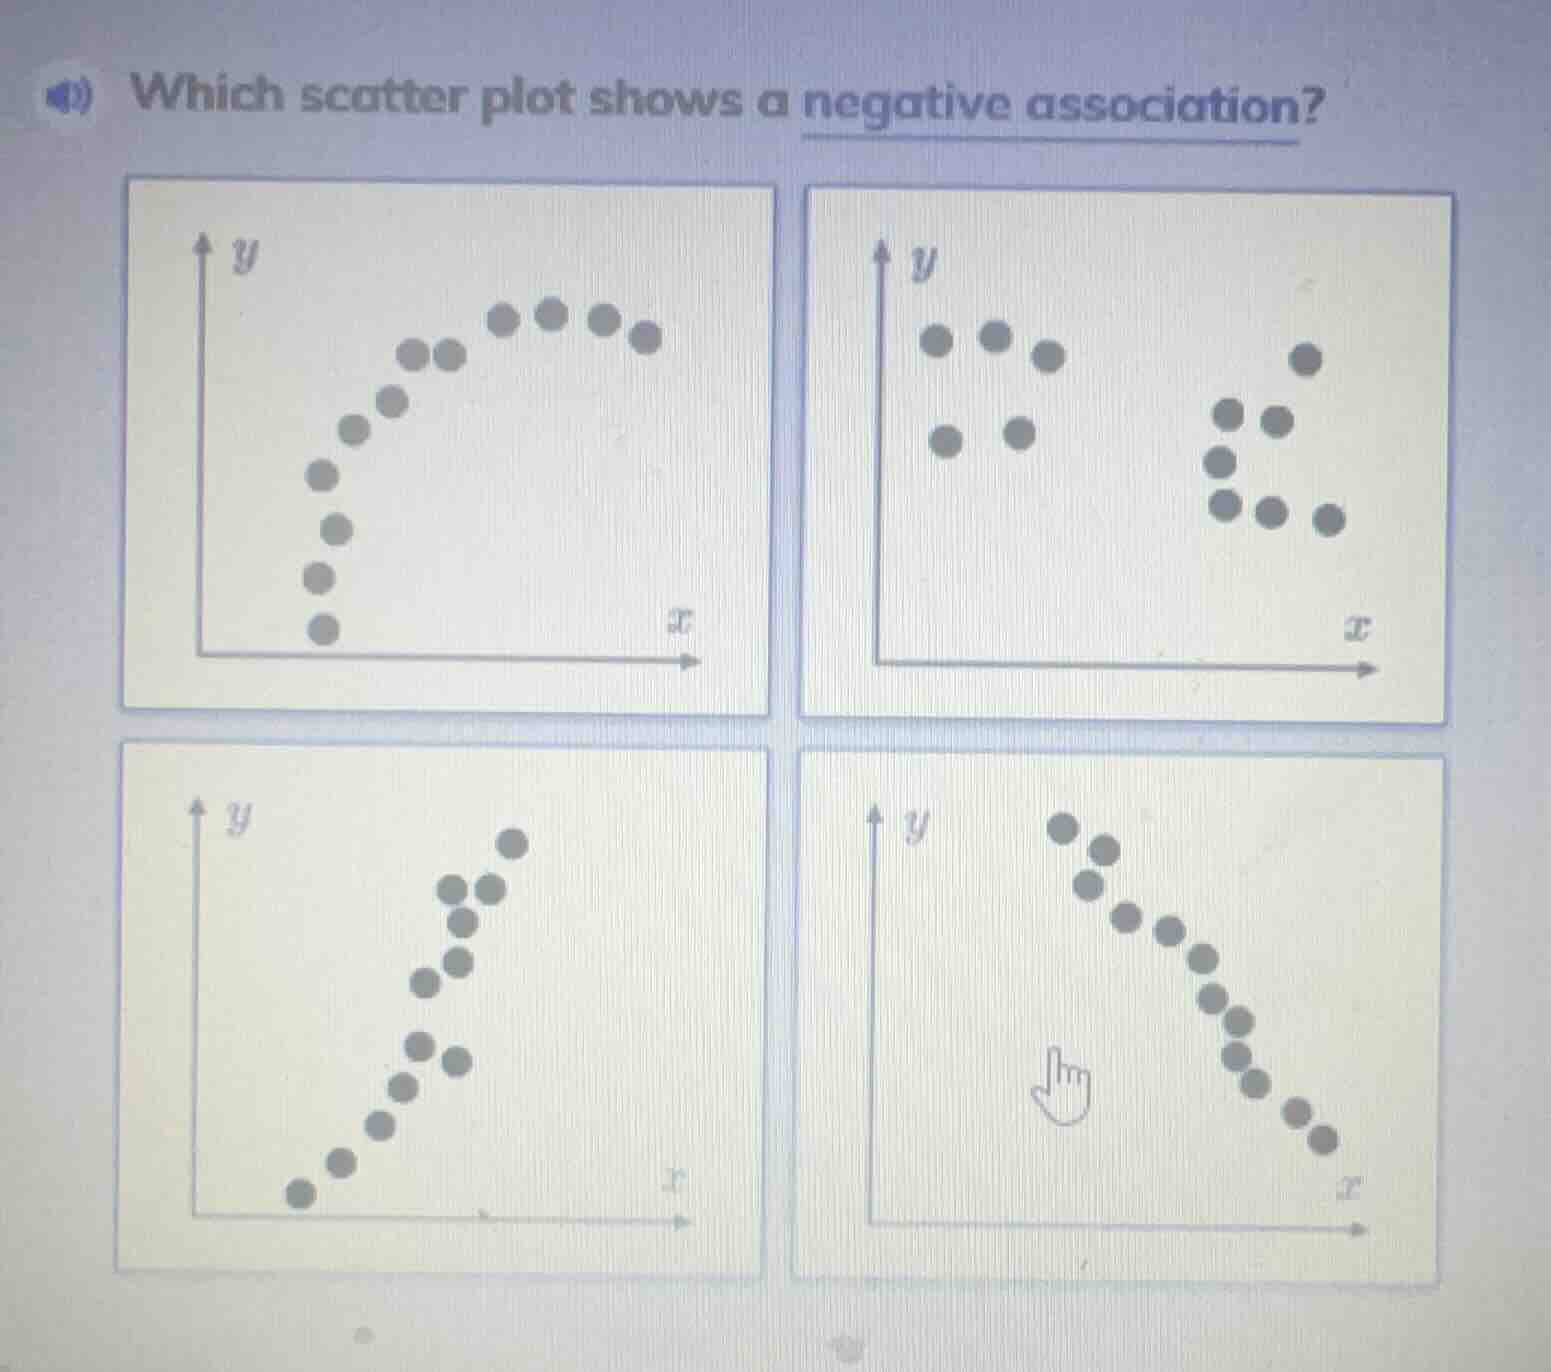
which scatter plot shows a negative association?
Brief Explanations
A negative association in a scatter plot means as the x-value increases, the y-value decreases. The bottom-right plot shows this pattern, while the top-left and bottom-right show positive associations, and the top-right shows no clear linear association.

Snap & solve any problem in the app
Get step-by-step solutions on Sovi AI
Photo-based solutions with guided steps
Explore more problems and detailed explanations
The bottom-right scatter plot (with points decreasing from top-left to bottom-right as x increases)