QUESTION IMAGE
Question
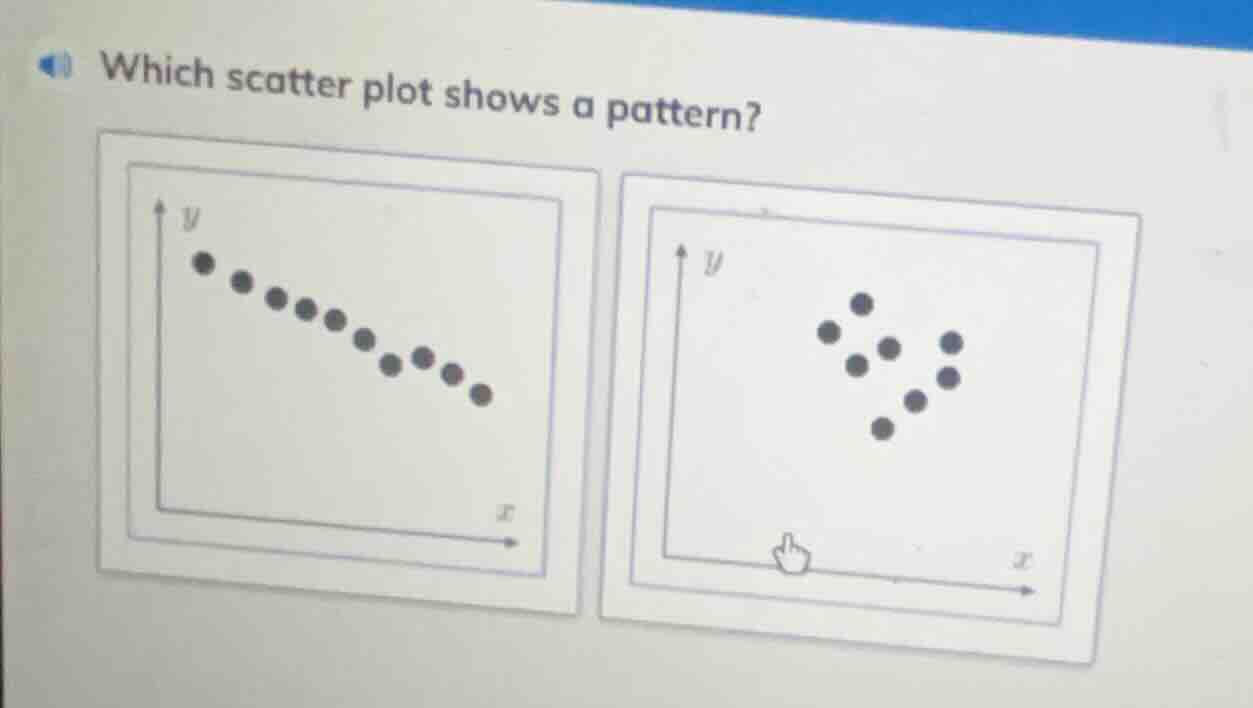
which scatter plot shows a pattern?
Brief Explanations
A scatter plot shows a pattern when points follow a clear, consistent trend. The left plot has points that form a steady downward linear trend, while the right plot's points are randomly clustered with no clear trend.

Snap & solve any problem in the app
Get step-by-step solutions on Sovi AI
Photo-based solutions with guided steps
Explore more problems and detailed explanations
The left scatter plot (with points forming a downward linear trend) shows a pattern.