QUESTION IMAGE
Question
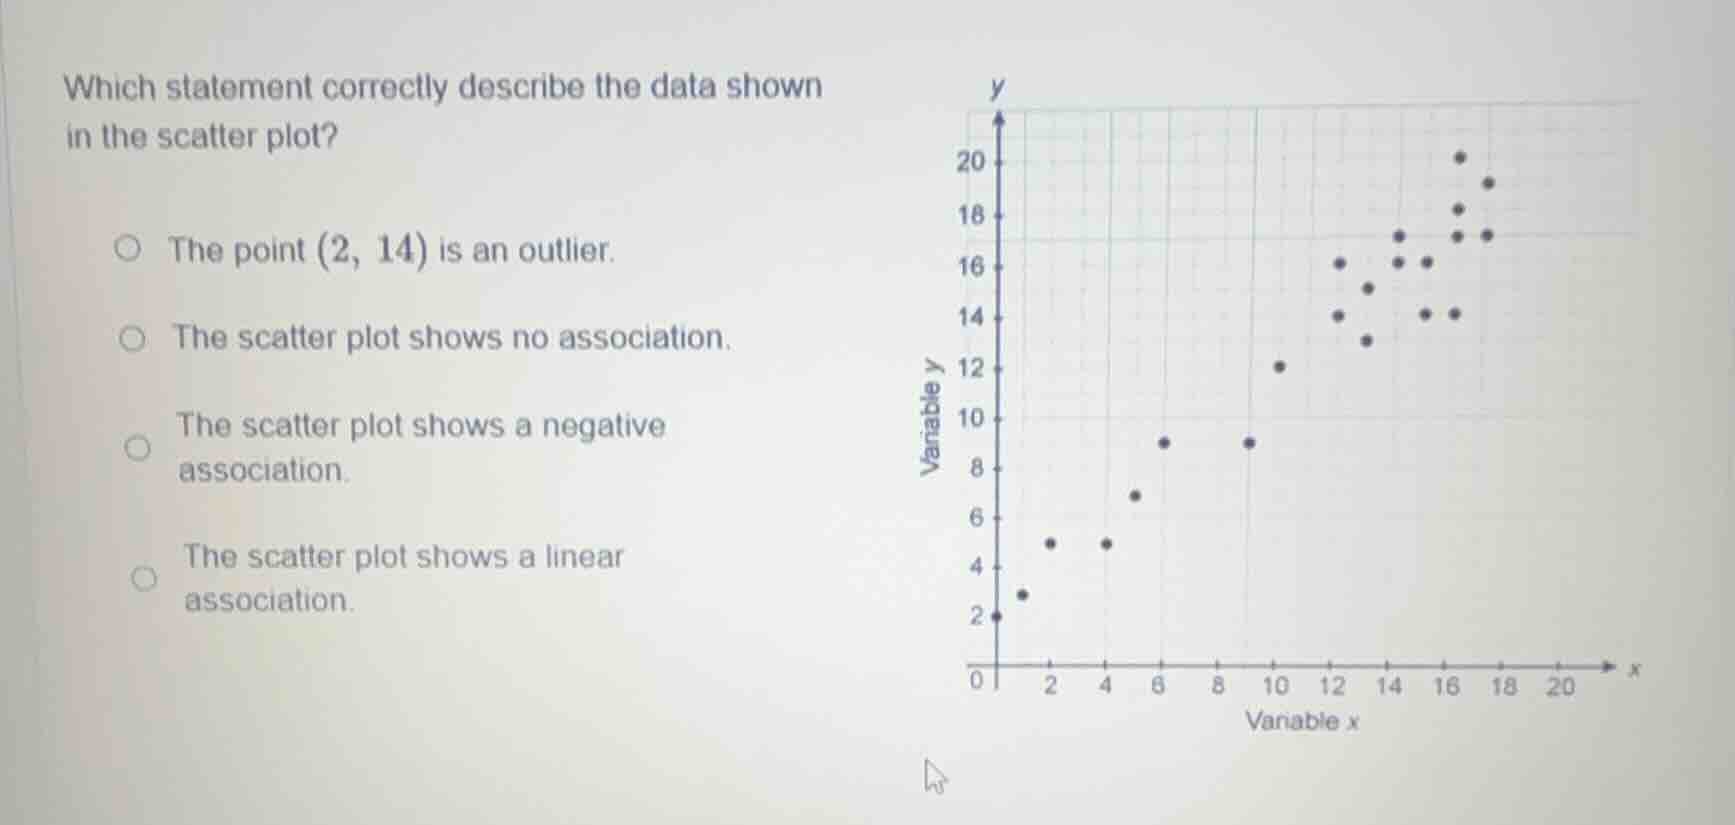
which statement correctly describe the data shown in the scatter plot?
the point (2, 14) is an outlier.
the scatter plot shows no association.
the scatter plot shows a negative association.
the scatter plot shows a linear association.
Brief Explanations
- Analyze "The point (2, 14) is an outlier": Looking at the scatter plot, at x = 2, the y - value is around 3 - 5, not 14, so (2, 14) is not a data point here, so this statement is wrong.
- Analyze "The scatter plot shows no association": The points generally show a trend where as x increases, y increases, so there is a positive association, so this statement is wrong.
- Analyze "The scatter plot shows a negative association": Since as x increases, y increases, it is a positive association, not negative, so this statement is wrong.
- Analyze "The scatter plot shows a linear association": The points seem to follow a roughly straight - line trend (as x increases, y increases in a somewhat linear way), so this statement is correct.

Snap & solve any problem in the app
Get step-by-step solutions on Sovi AI
Photo-based solutions with guided steps
Explore more problems and detailed explanations
The scatter plot shows a linear association.