QUESTION IMAGE
Question
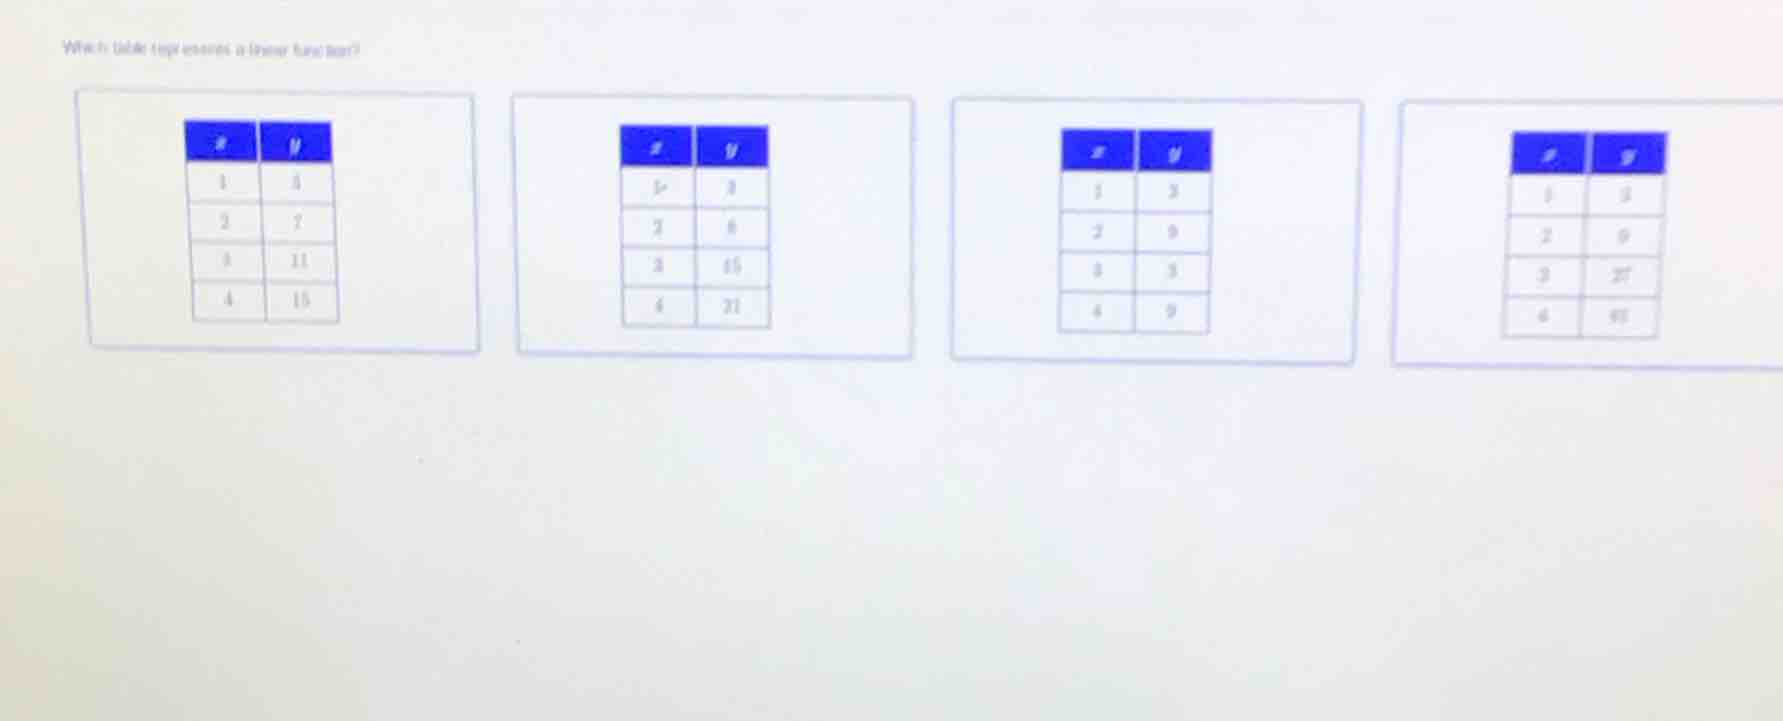
which table represents a linear function?
1.
| $x$ | $y$ |
|---|---|
| 2 | 7 |
| 3 | 11 |
| 4 | 15 |
2.
| $x$ | $y$ |
|---|---|
| 2 | 6 |
| 3 | 15 |
| 4 | 31 |
3.
| $x$ | $y$ |
|---|---|
| 2 | 9 |
| 3 | 3 |
| 4 | 9 |
4.
| $x$ | $y$ |
|---|---|
| 2 | 9 |
| 3 | 27 |
| 4 | 81 |
Step1: Recall linear function rule
A linear function has a constant rate of change (slope) between $x$ and $y$, meaning the difference in $y$-values is the same for each equal increase in $x$-values.
Step2: Check Table 1
Calculate $\Delta y$ for each $\Delta x=1$:
$7-3=4$, $11-7=4$, $15-11=4$
Constant $\Delta y=4$
Step3: Check Table 2
Calculate $\Delta y$ for each $\Delta x=1$:
$6-3=3$, $15-6=9$, $31-15=16$
$\Delta y$ is not constant
Step4: Check Table 3
Calculate $\Delta y$ for each $\Delta x=1$:
$9-3=6$, $3-9=-6$, $9-3=6$
$\Delta y$ is not constant
Step5: Check Table 4
Calculate $\Delta y$ for each $\Delta x=1$:
$9-3=6$, $27-9=18$, $81-27=54$
$\Delta y$ is not constant

Snap & solve any problem in the app
Get step-by-step solutions on Sovi AI
Photo-based solutions with guided steps
Explore more problems and detailed explanations
The first table (with $x$: 1,2,3,4 and $y$: 3,7,11,15) represents a linear function.