QUESTION IMAGE
Question
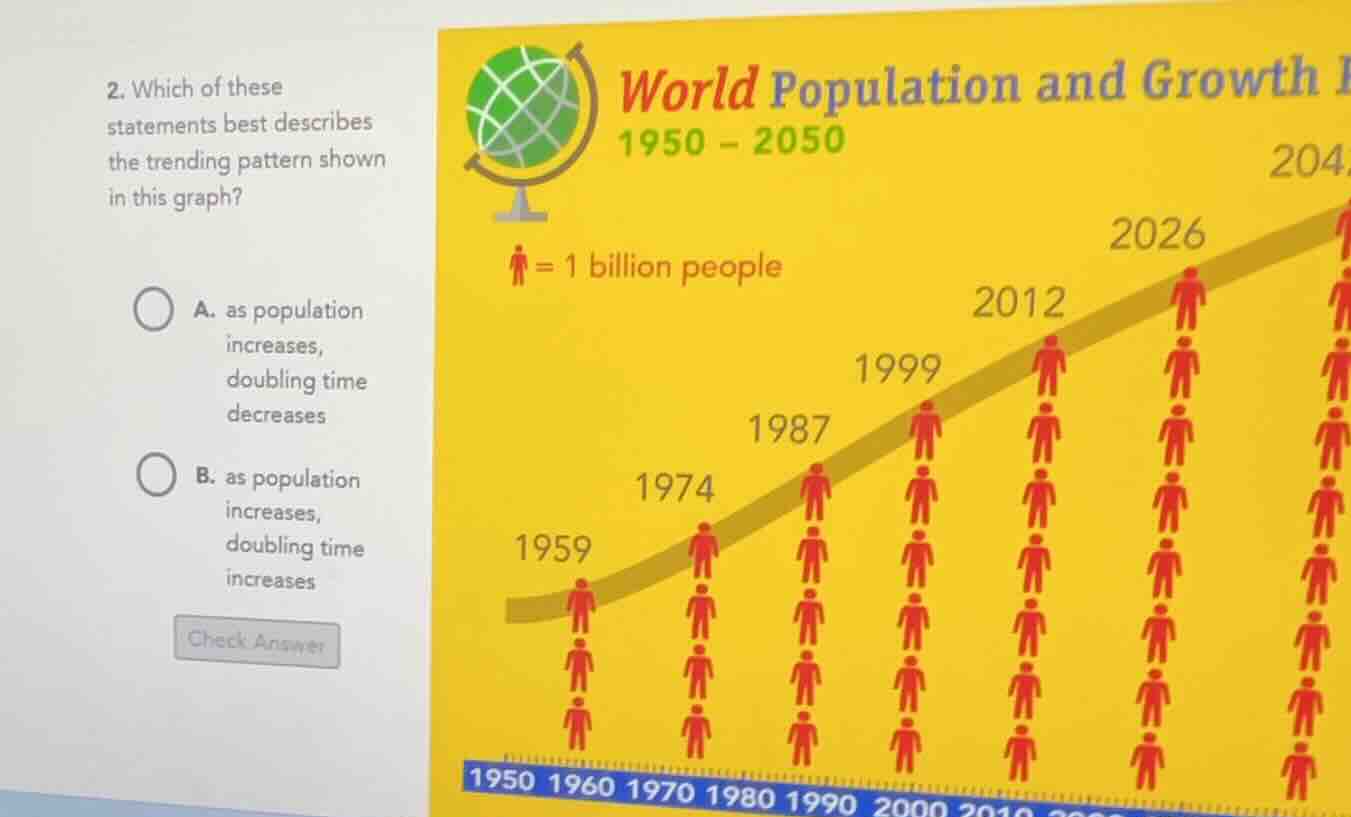
- which of these statements best describes the trending pattern shown in this graph? a. as population increases, doubling time decreases b. as population increases, doubling time increases
To determine the correct statement, we analyze the world population growth graph. Doubling time is the time it takes for a quantity to double. Looking at the graph, as the population (number of red figures) increases over time (from 1959 to later years), the time between each "doubling" (increase by 1 billion, then another billion, etc.) actually increases? Wait, no—wait, let's check the years. From 1959 (let's say population is 3 billion? Wait, the figures: 1959 has 3 figures? Wait, no, the key is 1 figure = 1 billion. So 1959: 3 billion? Wait, 1959: 3 figures (each 1 billion), so 3 billion. Then 1974: 4 billion? Wait, no, 1959: 3, 1974: 4? Wait, no, the years: 1959, 1974 (15 years later), 1987 (13 years later), 1999 (12 years later), 2012 (13 years later), 2026 (14 years later)? Wait, no, maybe I miscounted. Wait, the time between 1959 and 1974 is 15 years (population from, say, 3 to 4 billion? Wait, no, each figure is 1 billion. So 1959: 3 figures (3 billion), 1974: 4 figures (4 billion) – that's 15 years to add 1 billion. Then 1974 to 1987: 13 years to go from 4 to 5 billion. 1987 to 1999: 12 years to go from 5 to 6 billion. 1999 to 2012: 13 years to go from 6 to 7 billion. 2012 to 2026: 14 years to go from 7 to 8 billion. Wait, but actually, in reality, world population doubling time – as population grows, the doubling time increases? Wait, no, the formula for doubling time is \( T = \frac{\ln 2}{r} \), where \( r \) is the growth rate. If the growth rate \( r \) decreases (as population grows and resources become more limited, growth rate might slow), then doubling time \( T \) increases. So as population increases, doubling time increases. So option B says "as population increases, doubling time increases", which matches. Option A says doubling time decreases, which would be if growth rate increased, but in reality (and from the graph's time intervals), the time between each billion increase is getting longer (or at least not shorter), so doubling time increases.

Snap & solve any problem in the app
Get step-by-step solutions on Sovi AI
Photo-based solutions with guided steps
Explore more problems and detailed explanations
B. as population increases, doubling time increases