QUESTION IMAGE
Question
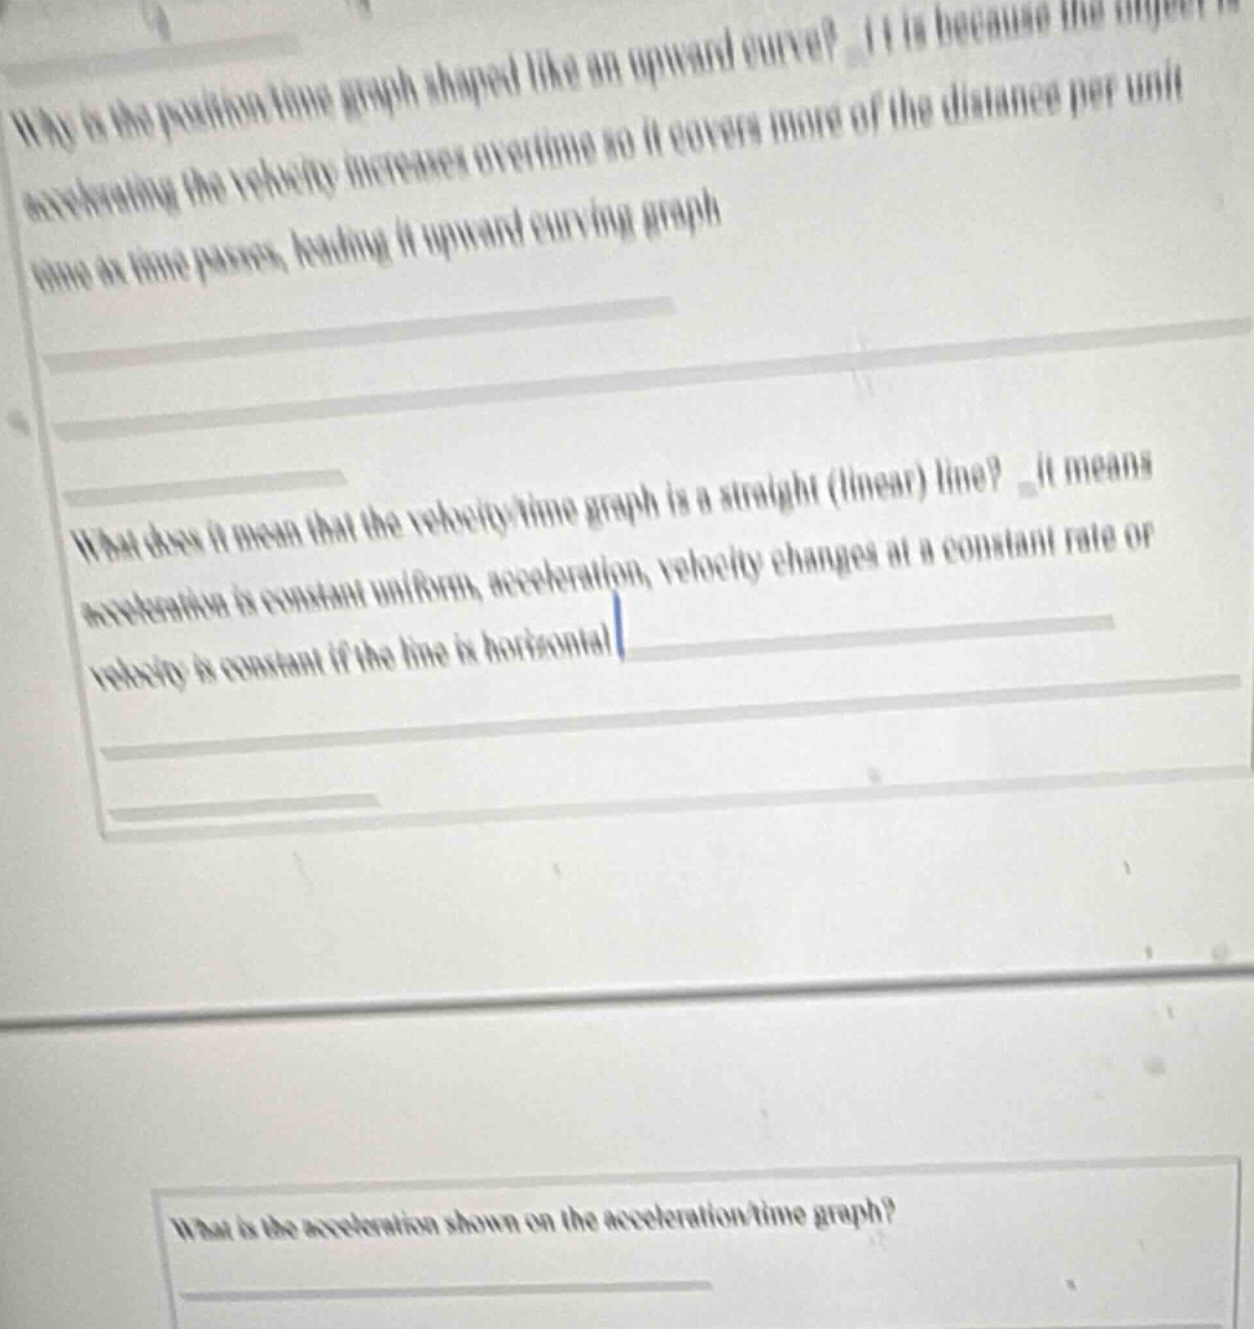
why is the position - time graph shaped like an upward curve? it is because the object is accelerating, the velocity increases over time so it covers more of the distance per unit time as time passes, leading to an upward - curving graph
what does it mean that the velocity - time graph is a straight (linear) line? it means acceleration is constant (uniform acceleration), velocity changes at a constant rate or velocity is constant if the line is horizontal
what is the acceleration shown on the acceleration - time graph?
To answer the question "What is the acceleration shown on the acceleration - time graph?", we need to analyze the graph's features:
Step 1: Recall the meaning of an acceleration - time graph
In an acceleration - time ($a - t$) graph, the y - axis represents acceleration and the x - axis represents time. The value of acceleration at a particular time (or the pattern of the graph) gives us the acceleration of the object.
Step 2: Analyze different graph patterns
- Case 1: Horizontal line (constant acceleration)
If the graph is a horizontal line (parallel to the time axis), it means that the acceleration of the object is constant. For example, if the line is at $a = 5\ m/s^{2}$ on the y - axis, the acceleration of the object is $5\ m/s^{2}$ at all the times represented on the x - axis.
- Case 2: Sloped line (changing acceleration)
If the graph is a straight line with a non - zero slope, it means that the acceleration is changing at a constant rate. The slope of the $a - t$ graph ($m=\frac{\Delta a}{\Delta t}$) gives the rate of change of acceleration (also known as jerk in physics).
- Case 3: Curved line (non - uniformly changing acceleration)
If the graph is a curve, it means that the acceleration is changing non - uniformly with time. To find the acceleration at a specific time, we can look at the y - value of the graph at that particular x (time) value.
Since the actual graph is not provided, we can only give the general method. But if we assume a common case (for example, a horizontal line at $a = a_0$), the acceleration shown on the graph would be equal to the y - coordinate of the graph (the value of acceleration) at the relevant time (or the constant value if it's a horizontal line).
If we consider a simple example where the acceleration - time graph is a horizontal line at $a = 3\ m/s^{2}$, then the acceleration shown on the graph is $3\ m/s^{2}$.
(Note: The specific answer depends on the actual acceleration - time graph. If you provide the graph or more details about its shape and values, we can give a more precise answer.)
If we assume a general case where the graph is a horizontal line (constant acceleration) with acceleration value $a$, the answer would be the value of $a$ (in appropriate units like $m/s^{2}$) as read from the y - axis of the acceleration - time graph. For example, if the graph is horizontal at $a = 4\ m/s^{2}$, the answer is $4\ m/s^{2}$.

Snap & solve any problem in the app
Get step-by-step solutions on Sovi AI
Photo-based solutions with guided steps
Explore more problems and detailed explanations
To answer the question "What is the acceleration shown on the acceleration - time graph?", we need to analyze the graph's features:
Step 1: Recall the meaning of an acceleration - time graph
In an acceleration - time ($a - t$) graph, the y - axis represents acceleration and the x - axis represents time. The value of acceleration at a particular time (or the pattern of the graph) gives us the acceleration of the object.
Step 2: Analyze different graph patterns
- Case 1: Horizontal line (constant acceleration)
If the graph is a horizontal line (parallel to the time axis), it means that the acceleration of the object is constant. For example, if the line is at $a = 5\ m/s^{2}$ on the y - axis, the acceleration of the object is $5\ m/s^{2}$ at all the times represented on the x - axis.
- Case 2: Sloped line (changing acceleration)
If the graph is a straight line with a non - zero slope, it means that the acceleration is changing at a constant rate. The slope of the $a - t$ graph ($m=\frac{\Delta a}{\Delta t}$) gives the rate of change of acceleration (also known as jerk in physics).
- Case 3: Curved line (non - uniformly changing acceleration)
If the graph is a curve, it means that the acceleration is changing non - uniformly with time. To find the acceleration at a specific time, we can look at the y - value of the graph at that particular x (time) value.
Since the actual graph is not provided, we can only give the general method. But if we assume a common case (for example, a horizontal line at $a = a_0$), the acceleration shown on the graph would be equal to the y - coordinate of the graph (the value of acceleration) at the relevant time (or the constant value if it's a horizontal line).
If we consider a simple example where the acceleration - time graph is a horizontal line at $a = 3\ m/s^{2}$, then the acceleration shown on the graph is $3\ m/s^{2}$.
(Note: The specific answer depends on the actual acceleration - time graph. If you provide the graph or more details about its shape and values, we can give a more precise answer.)
If we assume a general case where the graph is a horizontal line (constant acceleration) with acceleration value $a$, the answer would be the value of $a$ (in appropriate units like $m/s^{2}$) as read from the y - axis of the acceleration - time graph. For example, if the graph is horizontal at $a = 4\ m/s^{2}$, the answer is $4\ m/s^{2}$.