QUESTION IMAGE
Question
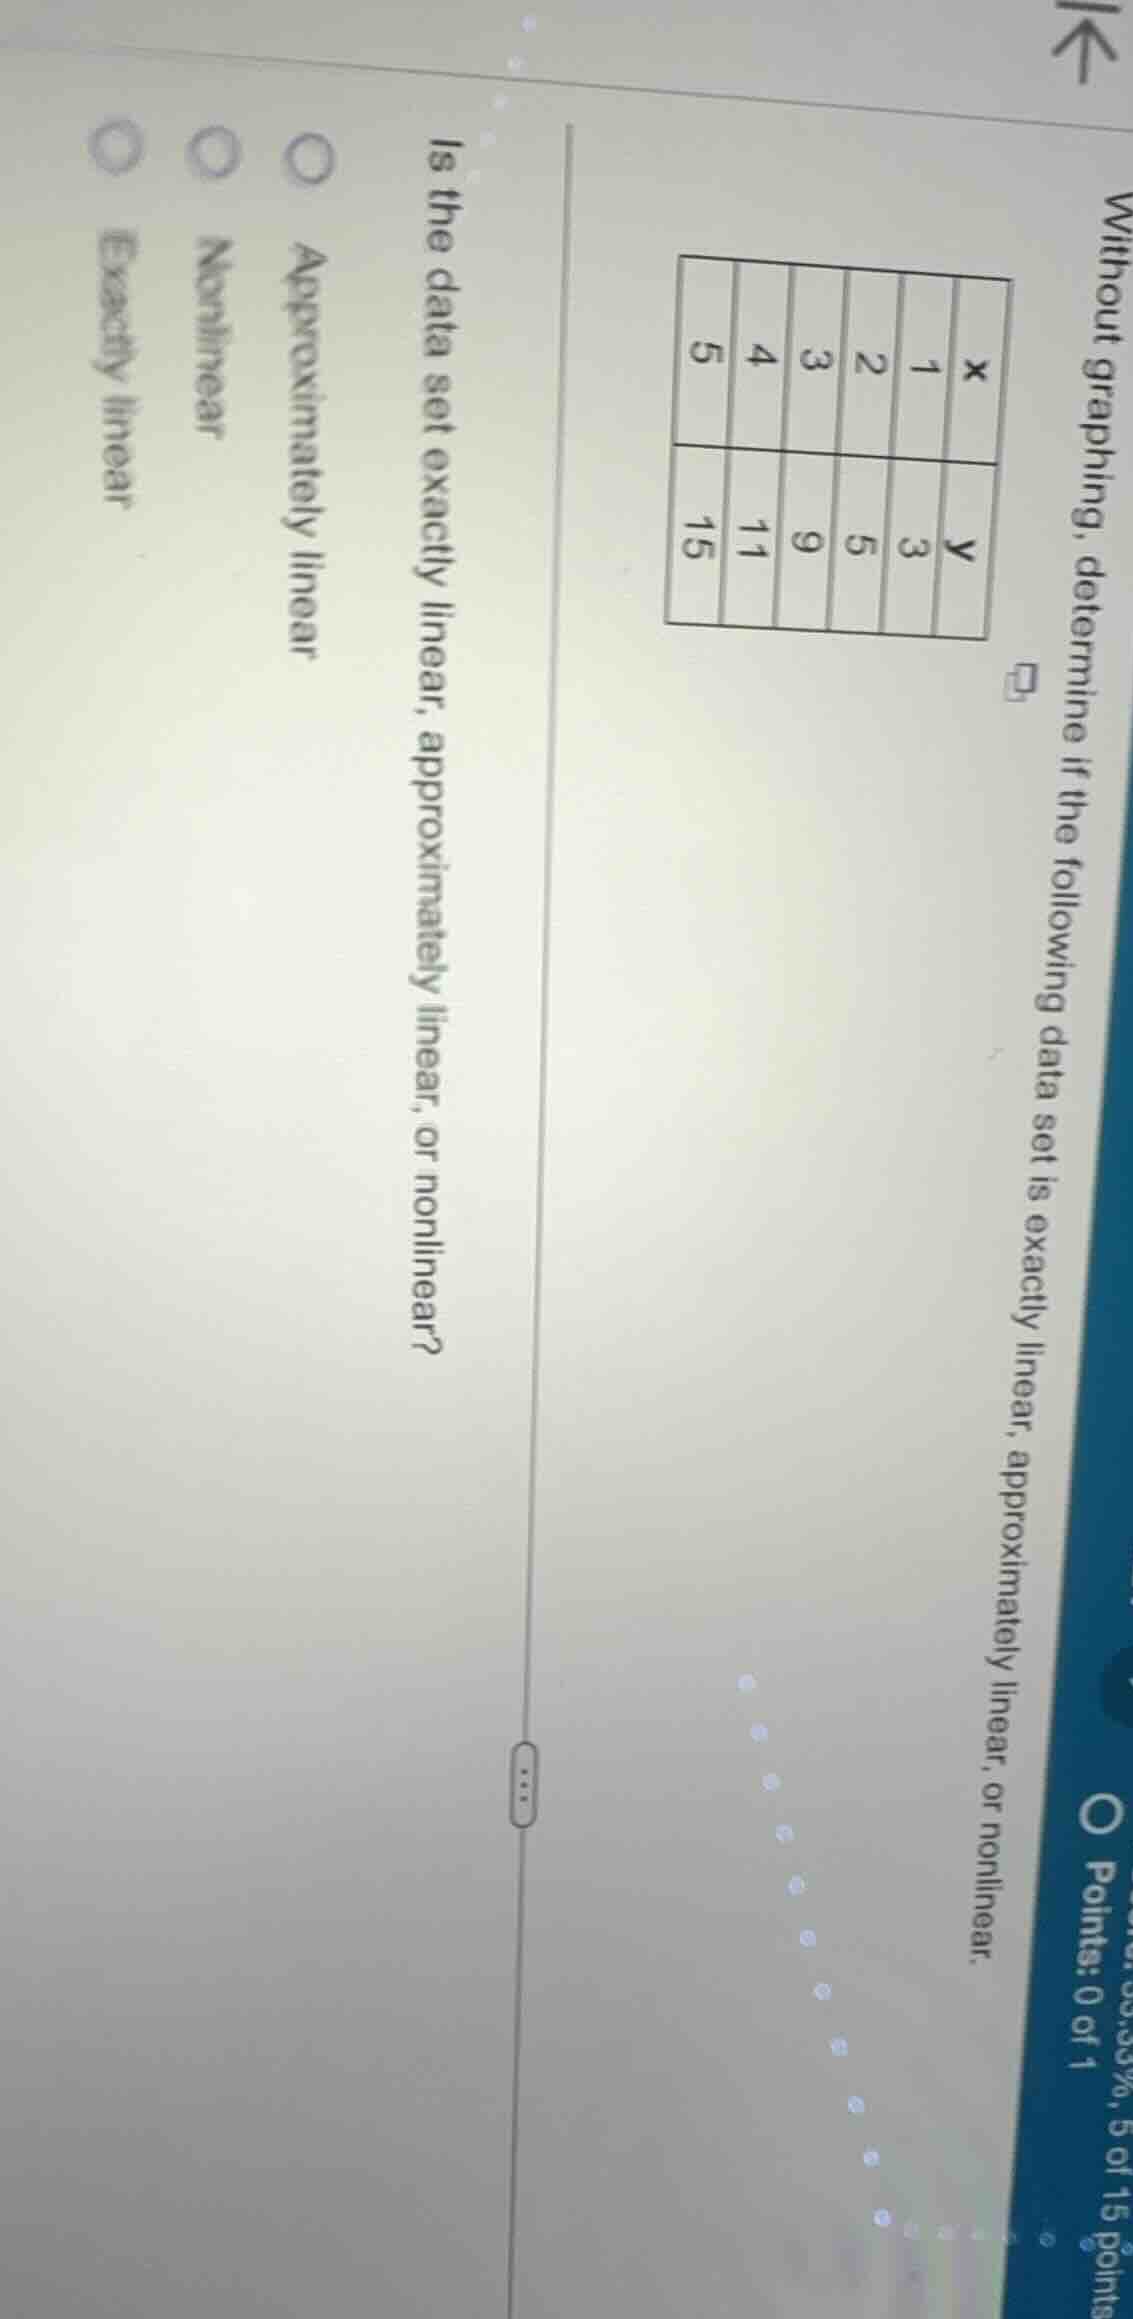
without graphing, determine if the following data set is exactly linear, approximately linear, or nonlinear. is the data set exactly linear, approximately linear, or nonlinear? \
\bigcirc approximately linear \bigcirc nonlinear \bigcirc exactly linear
Step1: Calculate x differences
$\Delta x_1=2-1=1$, $\Delta x_2=3-2=1$, $\Delta x_3=4-3=1$, $\Delta x_4=5-4=1$
Step2: Calculate y differences
$\Delta y_1=5-3=2$, $\Delta y_2=9-5=4$, $\Delta y_3=11-9=2$, $\Delta y_4=15-11=4$
Step3: Check linearity condition
For exact linearity, $\frac{\Delta y}{\Delta x}$ must be constant. Here $\frac{2}{1}
eq\frac{4}{1}$, so not exactly linear. The y differences alternate between 2 and 4, not close enough to be approximately linear.

Snap & solve any problem in the app
Get step-by-step solutions on Sovi AI
Photo-based solutions with guided steps
Explore more problems and detailed explanations
Nonlinear