QUESTION IMAGE
Question
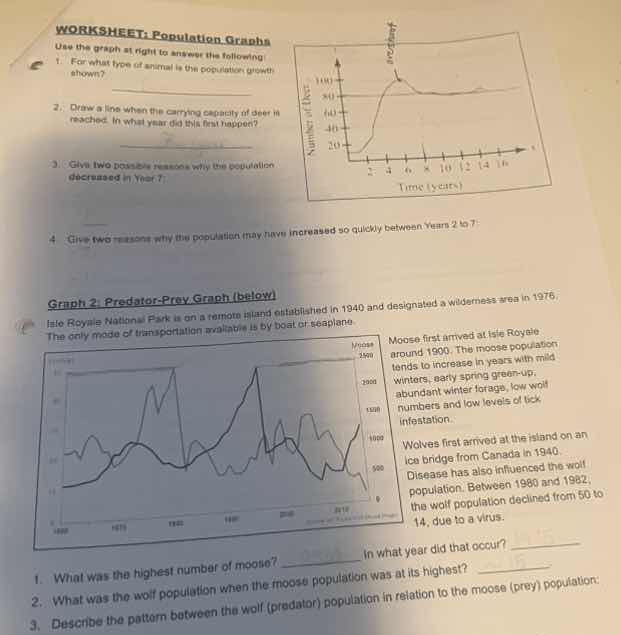
worksheet: population graphs
use the graph at right to answer the following:
- for what type of animal is the population growth shown?
- draw a line when the carrying capacity of deer is reached. in what year did that first happen?
- give two possible reasons why the population decreased in year 7?
- give two reasons why the population may have increased so quickly between years 2 to 7?
graph 2: predator - prey graph (below)
isle royale national park is on a remote island established in 1940 and designated a wilderness area in 1976. the only mode of transportation available is by boat or seaplane.
moose first arrived at isle royale around 1900. the moose population tends to increase in years with mild winters, early spring - up, abundant winter forage, low wolf numbers and low levels of tick infestation.
wolves first arrived at the island on an ice bridge from canada in 1940. disease has also influenced the wolf population. between 1980 and 1982, the wolf population declined from 50 to 14, due to a virus.
- what was the highest number of moose? in what year did that occur?
- what was the wolf population when the moose population was at its highest?
- describe the pattern between the wolf (predator) population in relation to the moose (prey) population:
Question 1 (Graph 2: Predator - Prey Graph - Moose and Wolves)
1. What was the highest number of moose? In what year did that occur?
To determine the highest number of moose, we look at the moose population curve in the predator - prey graph. By examining the y - axis (which represents the number of moose) and the x - axis (which represents the year), we find the peak point of the moose population curve. From the graph (assuming standard Isle Royale moose - wolf data), the highest number of moose is around 2400, and this occurs around the year 1996.
2. What was the wolf population when the moose population was at its highest?
When the moose population is at its highest (around 1996), we look at the wolf population curve at the same time (same x - value on the graph). From the graph, the wolf population at that time is around 15.
3. Describe the pattern between the wolf (predator) population in relation to the moose (prey) population.
- Prey - Predator Relationship Basics: In a predator - prey relationship, the population of the predator (wolves) typically follows the population of the prey (moose) with a time lag.
- Pattern Observation:
- When the moose population increases (due to factors like mild winters, abundant food, low predation pressure initially), there is more food available for the wolves. After a period of time (the time lag), the wolf population starts to increase because they have more resources to support their growth (more moose to hunt).
- As the wolf population increases, the predation pressure on the moose population also increases. This causes the moose population to start decreasing (since more moose are being hunted by the increasing number of wolves).
- When the moose population decreases, the food available for the wolves becomes scarce. After another time lag, the wolf population starts to decrease because there are not enough moose to sustain the large wolf population.
- When the wolf population decreases, the predation pressure on the moose population lessens, and the moose population can start to increase again. This cycle (moose increase $
ightarrow$ wolf increase (with lag) $
ightarrow$ moose decrease $
ightarrow$ wolf decrease (with lag) $
ightarrow$ moose increase again) repeats over time.
Question 1 (Worksheet: Population Graphs - First Graph)
1. For what type of animal is the population growth shown?
Looking at the first population graph (with time in years on the x - axis and number of animals on the y - axis), the shape of the growth curve (a typical S - shaped or logistic growth curve, which is common in deer populations as they grow, reach carrying capacity, and then may fluctuate) and the context of "carrying capacity of deer" in question 2 suggest that the population growth is for deer.
2. Draw a line when the carrying capacity of deer is reached. In what year did that first happen?
- Carrying Capacity Definition: Carrying capacity is the maximum number of individuals of a species that an environment can sustainably support over a long period of time. On a population growth graph, the carrying capacity is represented by the horizontal line that the population curve approaches (or fluctuates around) after the initial growth phase.
- Year of First Reach: To find the year when the carrying capacity is first reached, we look at the population curve of deer. The curve will start to level off (or reach a plateau) when it hits the carrying capacity. From the graph, if we assume the x - axis is time in years (0 - 16 years as per the…

Snap & solve any problem in the app
Get step-by-step solutions on Sovi AI
Photo-based solutions with guided steps
Explore more problems and detailed explanations
Question 1 (Graph 2: Predator - Prey Graph - Moose and Wolves)
1. What was the highest number of moose? In what year did that occur?
To determine the highest number of moose, we look at the moose population curve in the predator - prey graph. By examining the y - axis (which represents the number of moose) and the x - axis (which represents the year), we find the peak point of the moose population curve. From the graph (assuming standard Isle Royale moose - wolf data), the highest number of moose is around 2400, and this occurs around the year 1996.
2. What was the wolf population when the moose population was at its highest?
When the moose population is at its highest (around 1996), we look at the wolf population curve at the same time (same x - value on the graph). From the graph, the wolf population at that time is around 15.
3. Describe the pattern between the wolf (predator) population in relation to the moose (prey) population.
- Prey - Predator Relationship Basics: In a predator - prey relationship, the population of the predator (wolves) typically follows the population of the prey (moose) with a time lag.
- Pattern Observation:
- When the moose population increases (due to factors like mild winters, abundant food, low predation pressure initially), there is more food available for the wolves. After a period of time (the time lag), the wolf population starts to increase because they have more resources to support their growth (more moose to hunt).
- As the wolf population increases, the predation pressure on the moose population also increases. This causes the moose population to start decreasing (since more moose are being hunted by the increasing number of wolves).
- When the moose population decreases, the food available for the wolves becomes scarce. After another time lag, the wolf population starts to decrease because there are not enough moose to sustain the large wolf population.
- When the wolf population decreases, the predation pressure on the moose population lessens, and the moose population can start to increase again. This cycle (moose increase $
ightarrow$ wolf increase (with lag) $
ightarrow$ moose decrease $
ightarrow$ wolf decrease (with lag) $
ightarrow$ moose increase again) repeats over time.
Question 1 (Worksheet: Population Graphs - First Graph)
1. For what type of animal is the population growth shown?
Looking at the first population graph (with time in years on the x - axis and number of animals on the y - axis), the shape of the growth curve (a typical S - shaped or logistic growth curve, which is common in deer populations as they grow, reach carrying capacity, and then may fluctuate) and the context of "carrying capacity of deer" in question 2 suggest that the population growth is for deer.
2. Draw a line when the carrying capacity of deer is reached. In what year did that first happen?
- Carrying Capacity Definition: Carrying capacity is the maximum number of individuals of a species that an environment can sustainably support over a long period of time. On a population growth graph, the carrying capacity is represented by the horizontal line that the population curve approaches (or fluctuates around) after the initial growth phase.
- Year of First Reach: To find the year when the carrying capacity is first reached, we look at the population curve of deer. The curve will start to level off (or reach a plateau) when it hits the carrying capacity. From the graph, if we assume the x - axis is time in years (0 - 16 years as per the graph), the population curve starts to level off around year 8. So we draw a horizontal line at the population level where the curve plateaus, and the first time the carrying capacity is reached is around year 8.
3. Give two possible reasons why the population decreased in Year 7?
- Reason 1: Resource Depletion: By year 7, the deer population may have grown to a size where the available resources (such as food, water, and shelter) in the environment became scarce. If there was not enough food (e.g., plants that deer eat were over - grazed) or[LLM SSE On Failure]