QUESTION IMAGE
Question
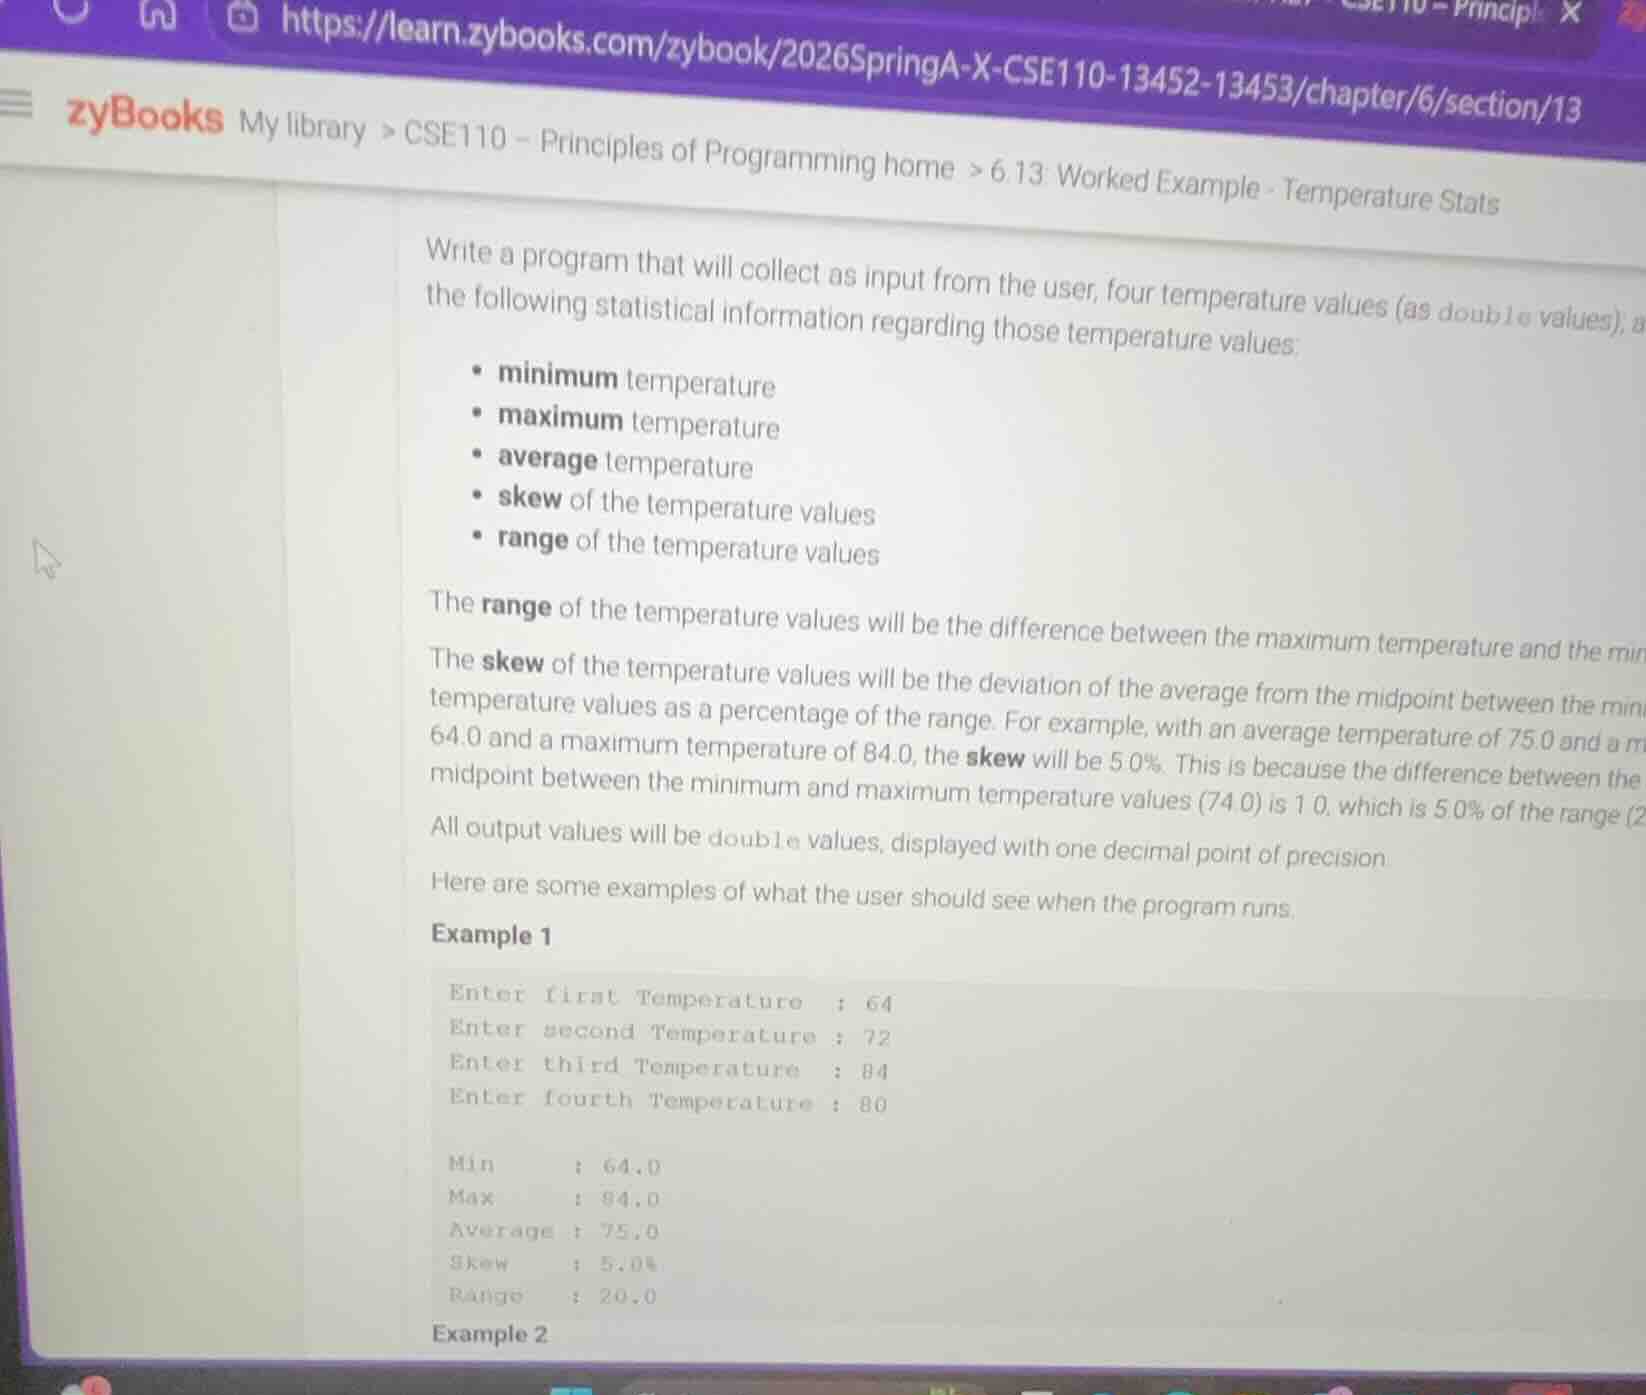
write a program that will collect as input from the user, four temperature values (as double values), a the following statistical information regarding those temperature values: - minimum temperature - maximum temperature - average temperature - skew of the temperature values - range of the temperature values the range of the temperature values will be the difference between the maximum temperature and the mi the skew of the temperature values will be the deviation of the average from the midpoint between the min temperature values as a percentage of the range. for example, with an average temperature of 75.0 and a m 64.0 and a maximum temperature of 84.0, the skew will be 5.0%. this is because the difference between the midpoint between the minimum and maximum temperature values (74.0) is 1.0, which is 5.0% of the range (2 all output values will be double values, displayed with one decimal point of precision. here are some examples of what the user should see when the program runs. example 1 enter first temperature : 64 enter second temperature : 72 enter third temperature : 84 enter fourth temperature : 80 min : 64.0 max : 84.0 average : 75.0 skew : 5.0% range : 20.0 example 2
Step1: Define input collection
Prompt user for 4 temperatures, store as double list:
temps = []
for i in range(4):
    temp = float(input(f"Enter {['first', 'second', 'third', 'fourth'][i]} Temperature : "))
    temps.append(temp)
Step2: Calculate minimum temperature
Find smallest value in the list:
min_temp = min(temps)Step3: Calculate maximum temperature
Find largest value in the list:
max_temp = max(temps)Step4: Calculate average temperature
Sum values, divide by count:
avg_temp = sum(temps) / len(temps)Step5: Calculate temperature range
Subtract min from max:
temp_range = max_temp - min_tempStep6: Calculate temperature skew
Compute midpoint, deviation, then percentage of range:
midpoint = (min_temp + max_temp) / 2
deviation = avg_temp - midpoint
skew = (deviation / temp_range) * 100 if temp_range != 0 else 0.0
Step7: Format and print output
Display all values with 1 decimal place:
print(f"
Min     : {min_temp:.1f}")
print(f"Max     : {max_temp:.1f}")
print(f"Average : {avg_temp:.1f}")
print(f"Skew    : {skew:.1f}%")
print(f"Range   : {temp_range:.1f}")
Snap & solve any problem in the app
Get step-by-step solutions on Sovi AI
Photo-based solutions with guided steps
Explore more problems and detailed explanations
# Collect input temperatures
temps = []
labels = ["first", "second", "third", "fourth"]
for label in labels:
    temp = float(input(f"Enter {label} Temperature : "))
    temps.append(temp)

# Calculate statistics
min_temp = min(temps)
max_temp = max(temps)
avg_temp = sum(temps) / len(temps)
temp_range = max_temp - min_temp
midpoint = (min_temp + max_temp) / 2
deviation = avg_temp - midpoint
skew = (deviation / temp_range) * 100 if temp_range != 0 else 0.0

# Print formatted output
print(f"
Min     : {min_temp:.1f}")
print(f"Max     : {max_temp:.1f}")
print(f"Average : {avg_temp:.1f}")
print(f"Skew    : {skew:.1f}%")
print(f"Range   : {temp_range:.1f}")
When run with the sample input 64, 72, 84, 80, the output matches Example 1:
Enter first Temperature : 64
Enter second Temperature : 72
Enter third Temperature : 84
Enter fourth Temperature : 80

Min     : 64.0
Max     : 84.0
Average : 75.0
Skew    : 5.0%
Range   : 20.0