QUESTION IMAGE
Question
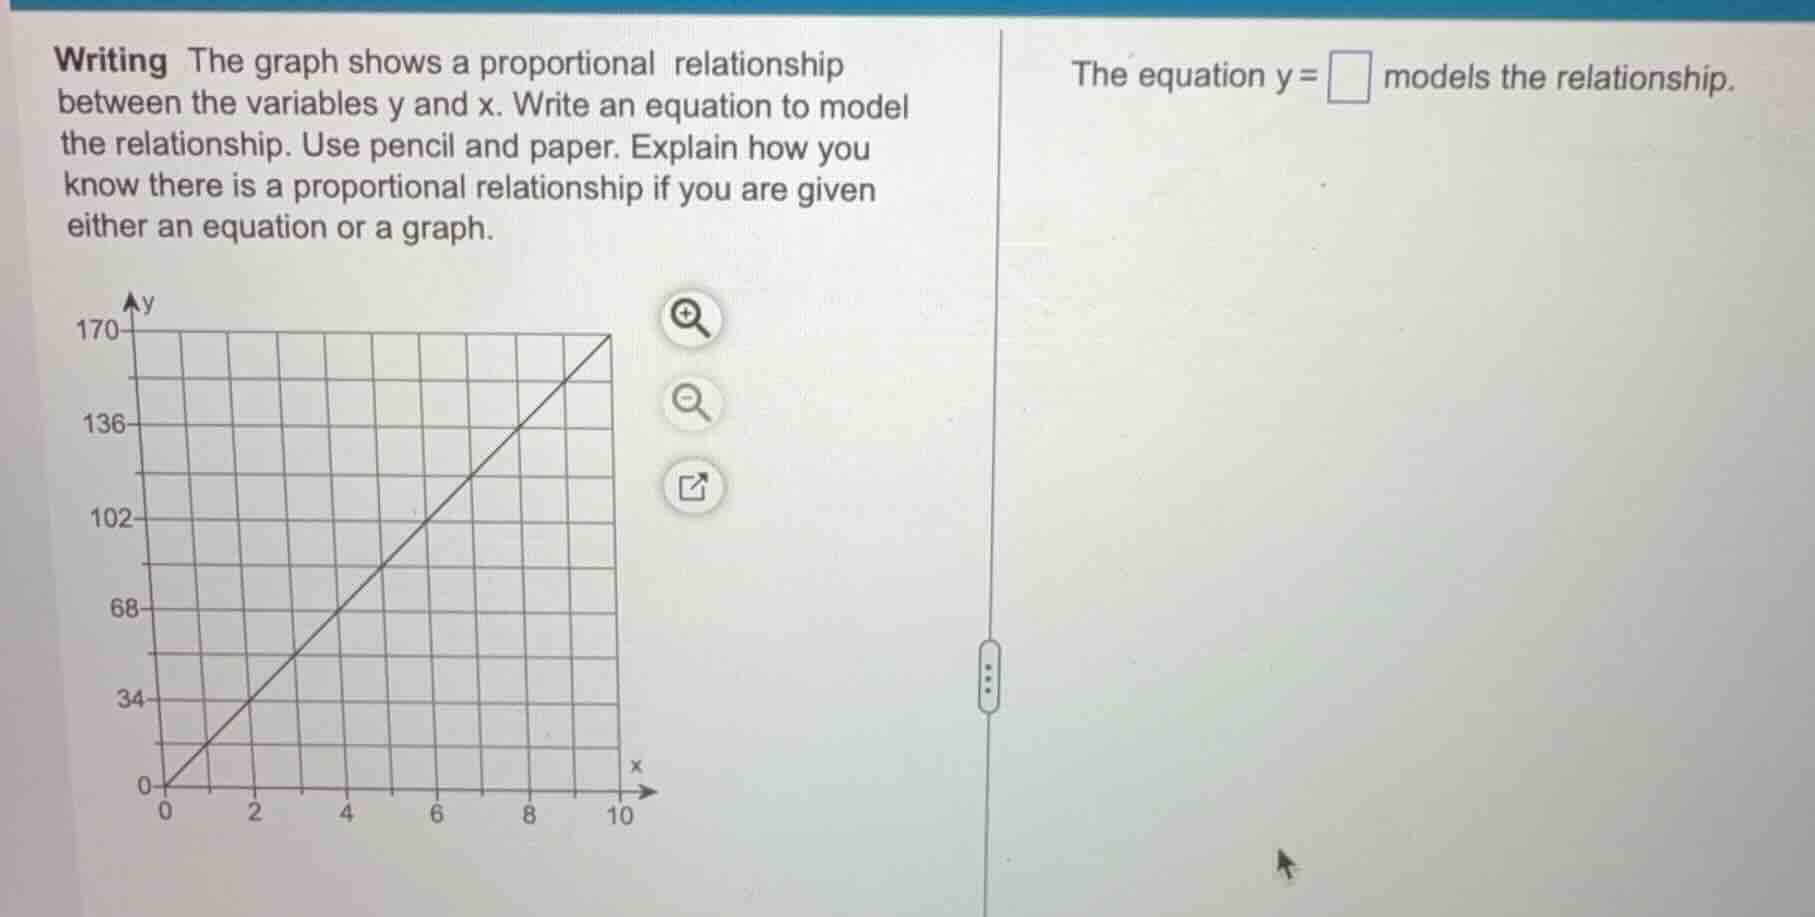
writing the graph shows a proportional relationship between the variables y and x. write an equation to model the relationship. use pencil and paper. explain how you know there is a proportional relationship if you are given either an equation or a graph.
the equation $y=\square$ models the relationship.
Step1: Recall proportional form
Proportional equations follow $y=kx$, where $k$ is the constant of proportionality.
Step2: Calculate $k$ from a point
Use the point $(2, 34)$: $k=\frac{y}{x}=\frac{34}{2}=17$.
Verify with another point, e.g., $(10,170)$: $k=\frac{170}{10}=17$.
Step3: Write the final equation
Substitute $k=17$ into $y=kx$.

Snap & solve any problem in the app
Get step-by-step solutions on Sovi AI
Photo-based solutions with guided steps
Explore more problems and detailed explanations
$y=17x$
Additional Explanation for proportionality check:
- For a graph: A proportional relationship is a straight line that passes through the origin $(0,0)$, and the ratio $\frac{y}{x}$ is constant for all points on the line.
- For an equation: It follows the form $y=kx$ (no constant term added or subtracted), where $k$ is a non-zero constant.