QUESTION IMAGE
Question
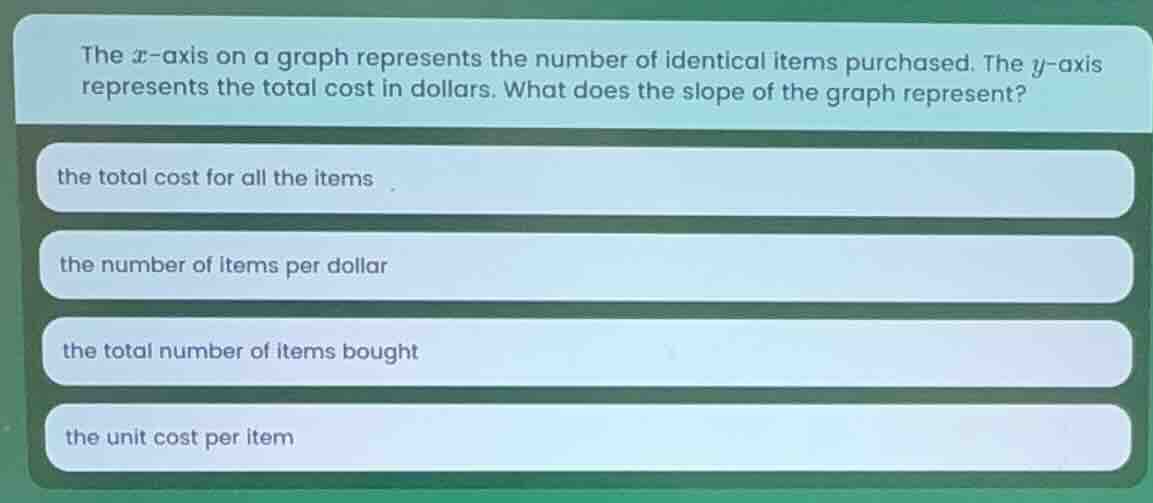
the x-axis on a graph represents the number of identical items purchased. the y-axis represents the total cost in dollars. what does the slope of the graph represent?
the total cost for all the items
the number of items per dollar
the total number of items bought
the unit cost per item
Brief Explanations
Slope is calculated as the change in y divided by the change in x. Here, y is total cost (dollars) and x is number of items. So slope = $\frac{\text{Change in total cost}}{\text{Change in number of items}}$, which equals the cost per single item.

Snap & solve any problem in the app
Get step-by-step solutions on Sovi AI
Photo-based solutions with guided steps
Explore more problems and detailed explanations
the unit cost per item