QUESTION IMAGE
Question
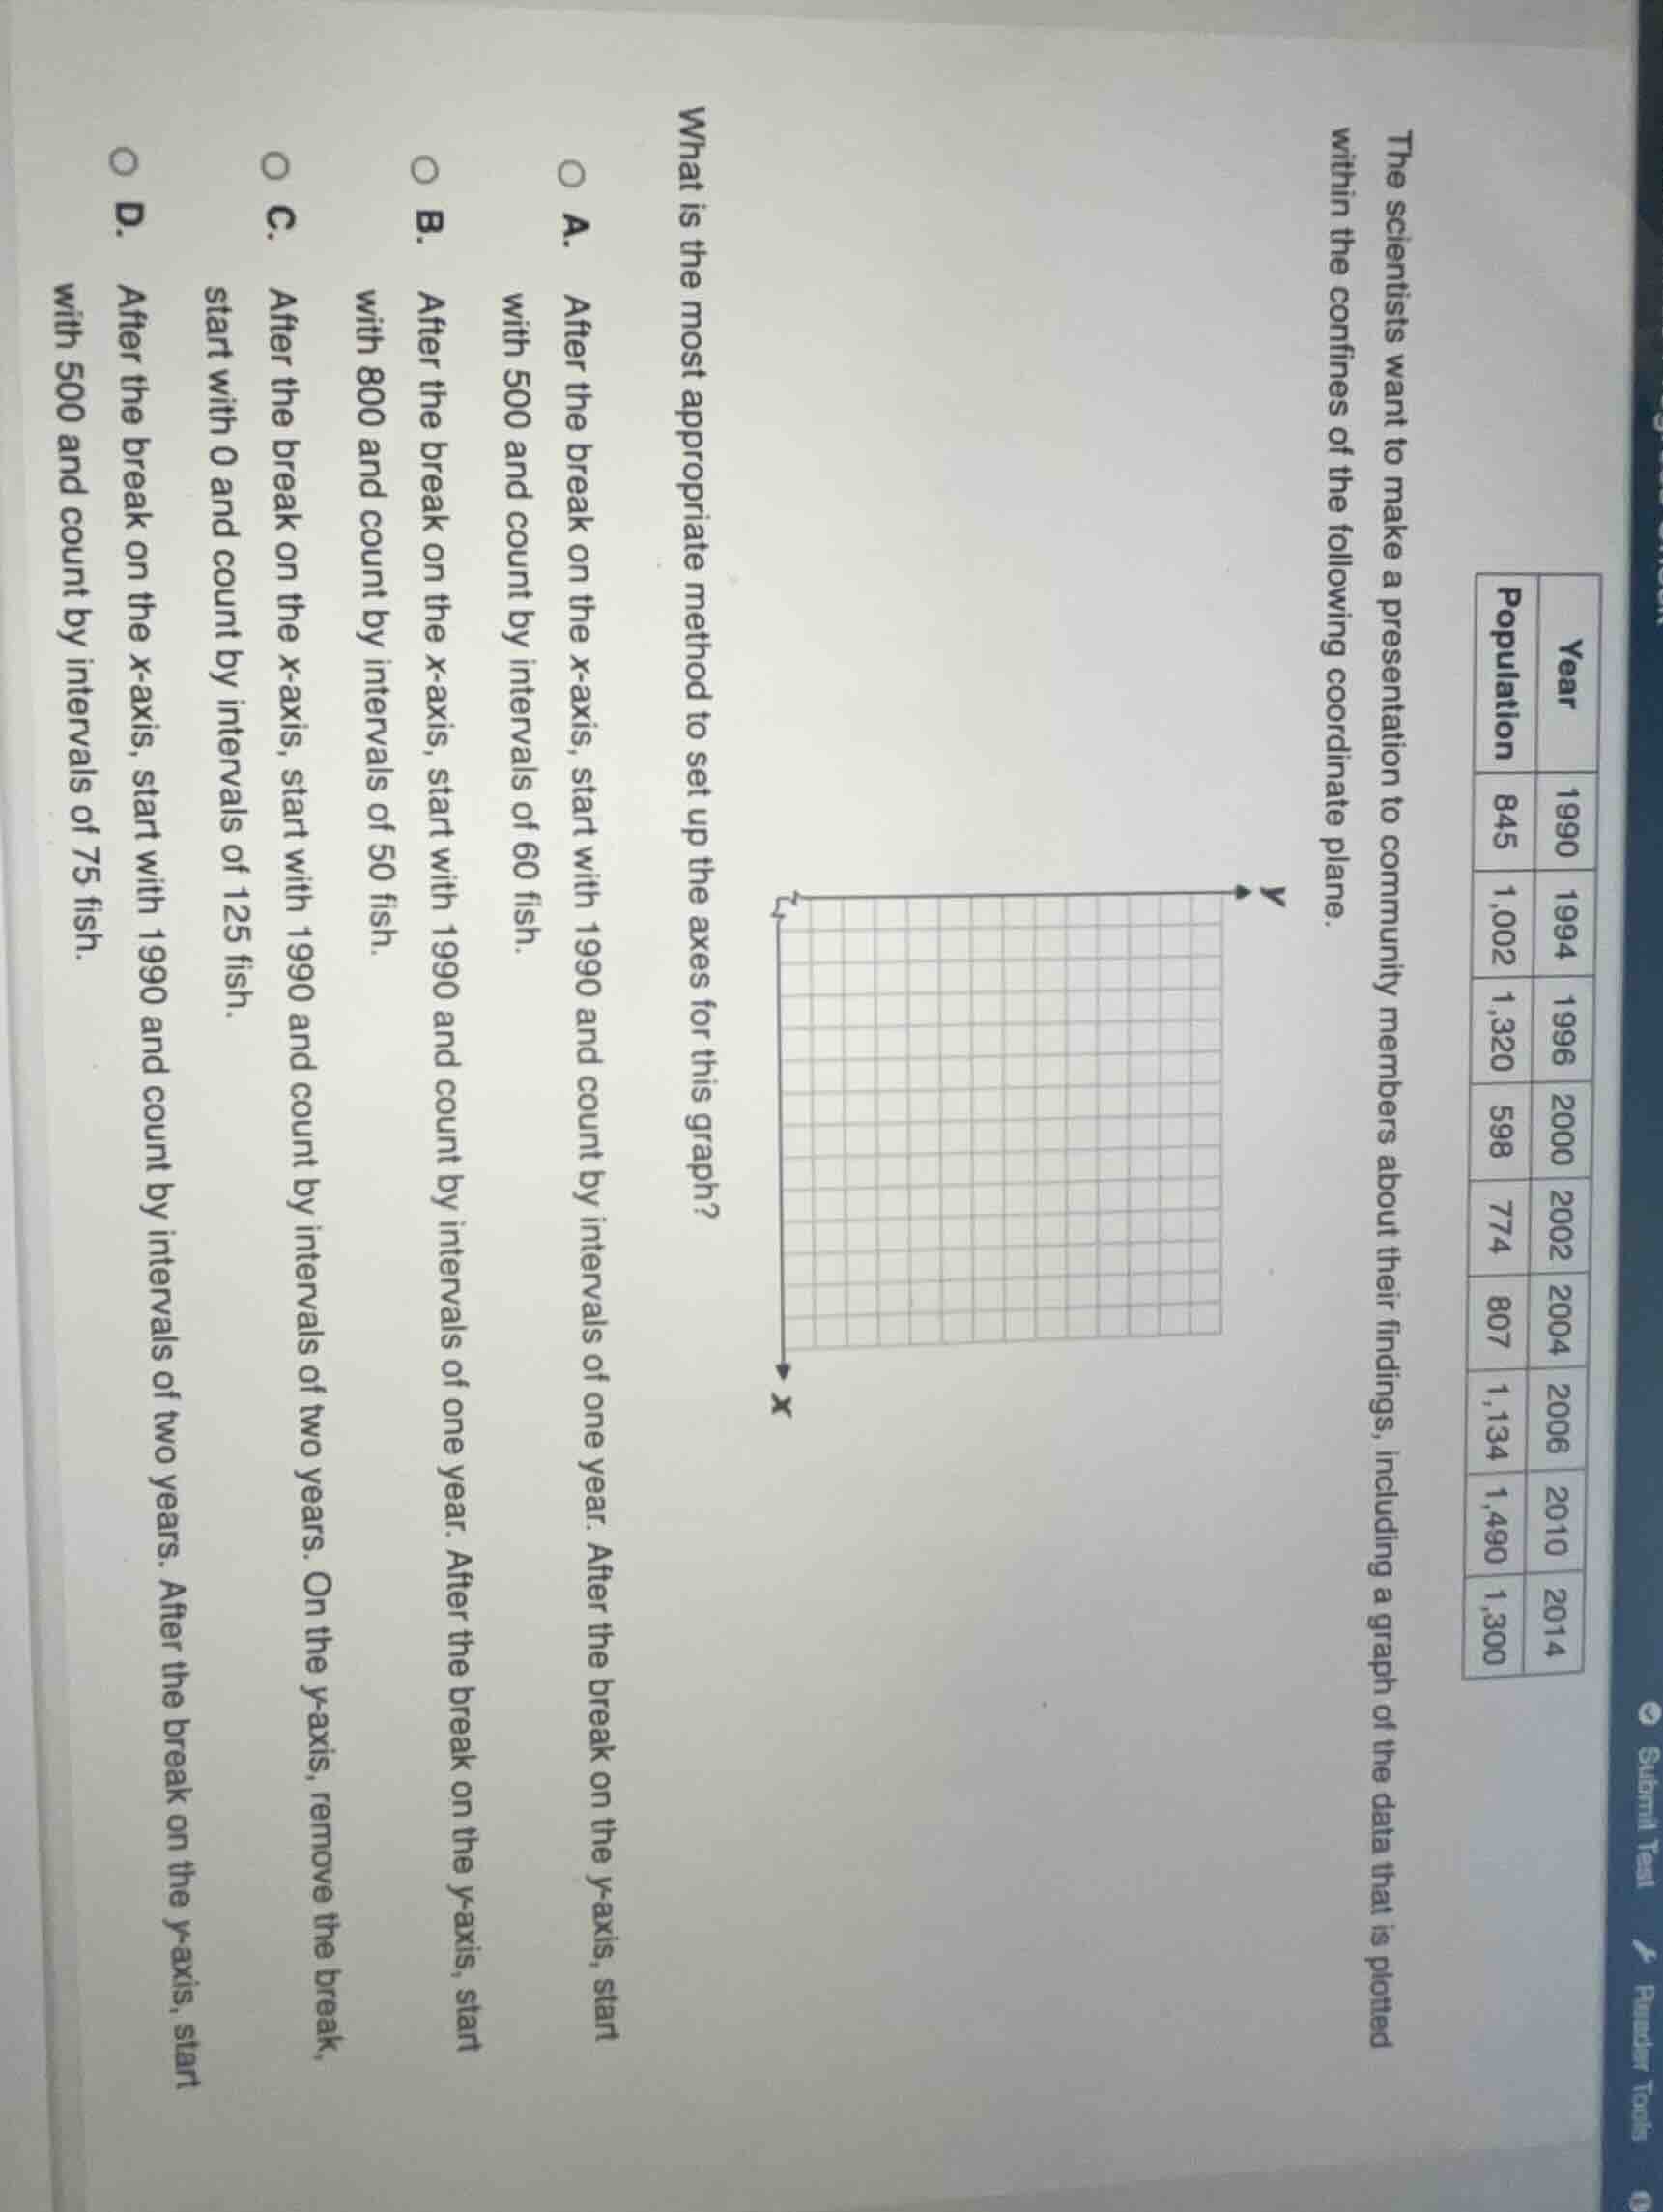
| year | population | ---- | ---- | 1990 | 845 | 1994 | 1,002 | 1996 | 1,320 | 2000 | 598 | 2002 | 774 | 2004 | 807 | 2006 | 1,134 | 2010 | 1,490 | 2014 | 1,300 | the scientists want to make a presentation to community members about their findings, including a graph of the data that is plotted within the confines of the following coordinate plane.what is the most appropriate method to set up the axes for this graph?a. after the break on the x-axis, start with 1990 and count by intervals of one year. after the break on the y-axis, start with 500 and count by intervals of 60 fish.b. after the break on the x-axis, start with 1990 and count by intervals of one year. after the break on the y-axis, start with 800 and count by intervals of 50 fish.c. after the break on the x-axis, start with 1990 and count by intervals of two years. on the y-axis, remove the break, start with 0 and count by intervals of 125 fish.d. after the break on the x-axis, start with 1990 and count by intervals of two years. after the break on the y-axis, start with 500 and count by intervals of 75 fish. |
Brief Explanations
- Analyze x-axis (Year) data: The years are 1990, 1994, 1996, 2000, 2002, 2004, 2006, 2010, 2014. The intervals between consecutive data points are mostly 2 years, so counting by 2-year intervals starting at 1990 is logical. A break is not needed as we start at the first data point.
- Analyze y-axis (Population) data: The population values range from 598 to 1490. Starting at 500 (a value just below the minimum data point) and using intervals of 75 creates a clear, evenly spaced scale that fits all data points without unnecessary empty space.
- Evaluate options:
- A: Counting by 1 year on x-axis is inefficient; 60-interval y-axis is too narrow.
- B: Counting by 1 year on x-axis is inefficient; 50-interval y-axis is too narrow.
- C: Starting y-axis at 0 would waste space as the lowest population is 598.
- D: Matches the logical x-axis (2-year intervals from 1990) and y-axis (start at 500, 75 intervals) setup.

Snap & solve any problem in the app
Get step-by-step solutions on Sovi AI
Photo-based solutions with guided steps
Explore more problems and detailed explanations
D. After the break on the x-axis, start with 1990 and count by intervals of two years. After the break on the y-axis, start with 500 and count by intervals of 75 fish.