QUESTION IMAGE
Question
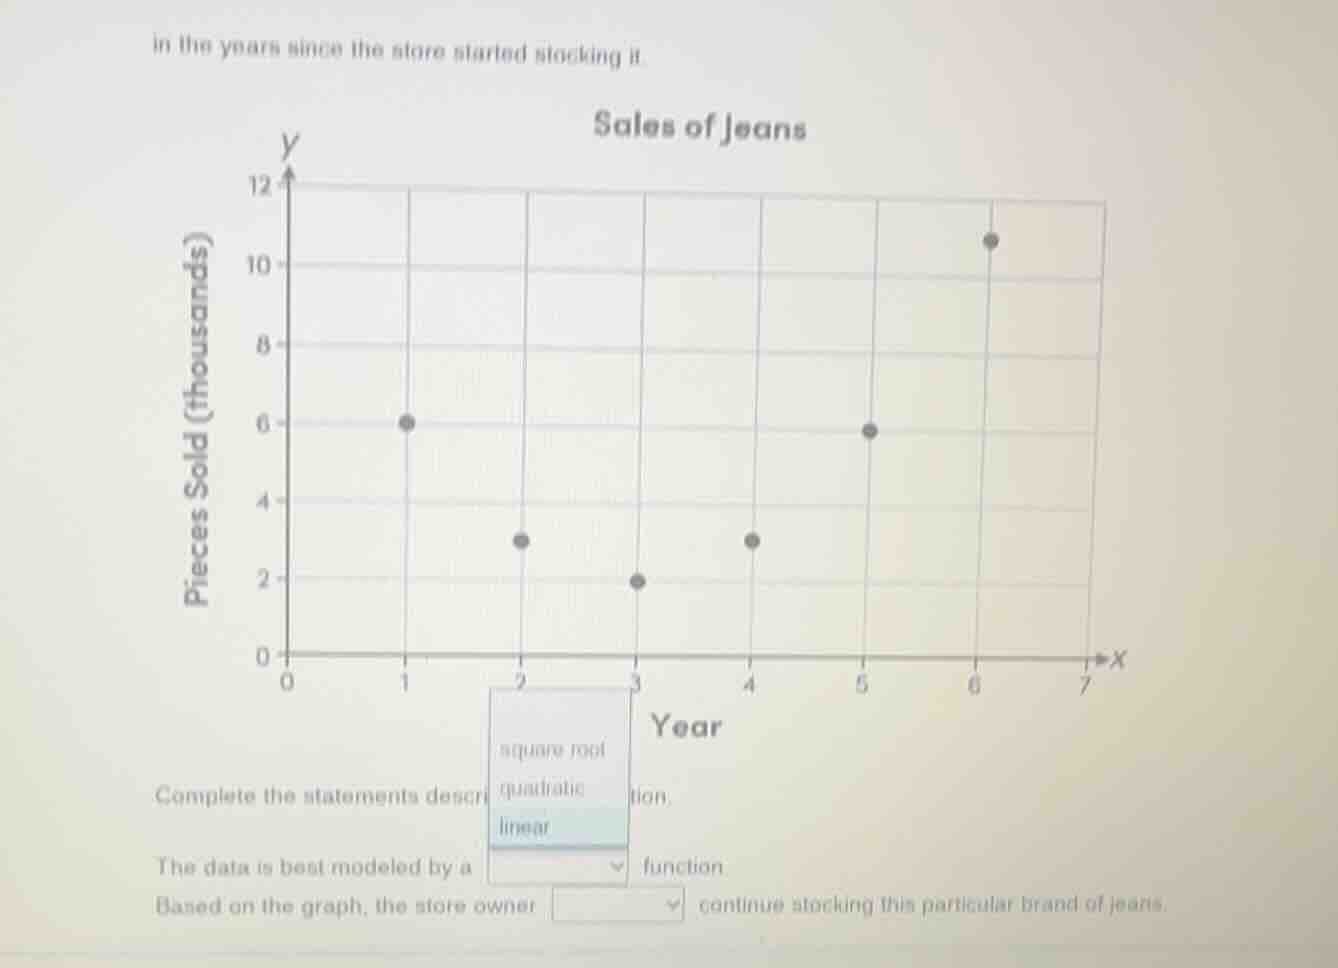
in the years since the store started stocking it.
sales of jeans
complete the statements descr
the data is best modeled by a ▼ function
based on the graph, the store owner ▼ continue stocking this particular brand of jeans.
Step1: Analyze the data pattern
Looking at the scatter plot, we can observe the trend of the number of jeans sold over the years. The data points seem to follow a pattern that can be modeled by a quadratic function (since it has a U - shape, increasing after a minimum point). A linear function would have a constant slope, but here the slope first decreases (sales decrease then increase), so it's not linear. A square - root function has a different growth pattern (slowly increasing and curving in a different way). So the data is best modeled by a quadratic function.
Step2: Analyze the trend for stocking decision
Since the number of jeans sold (in thousands) is increasing in the later years (from year 3 onwards, the sales are increasing: at year 3 it's 2, year 4 it's 3, year 5 it's 6, year 6 it's 11), which shows a positive trend in sales. So the store owner should continue stocking this particular brand of jeans.

Snap & solve any problem in the app
Get step-by-step solutions on Sovi AI
Photo-based solutions with guided steps
Explore more problems and detailed explanations
The data is best modeled by a \(\boldsymbol{\text{quadratic}}\) function. Based on the graph, the store owner \(\boldsymbol{\text{should}}\) continue stocking this particular brand of jeans.