QUESTION IMAGE
Question
do you know how?
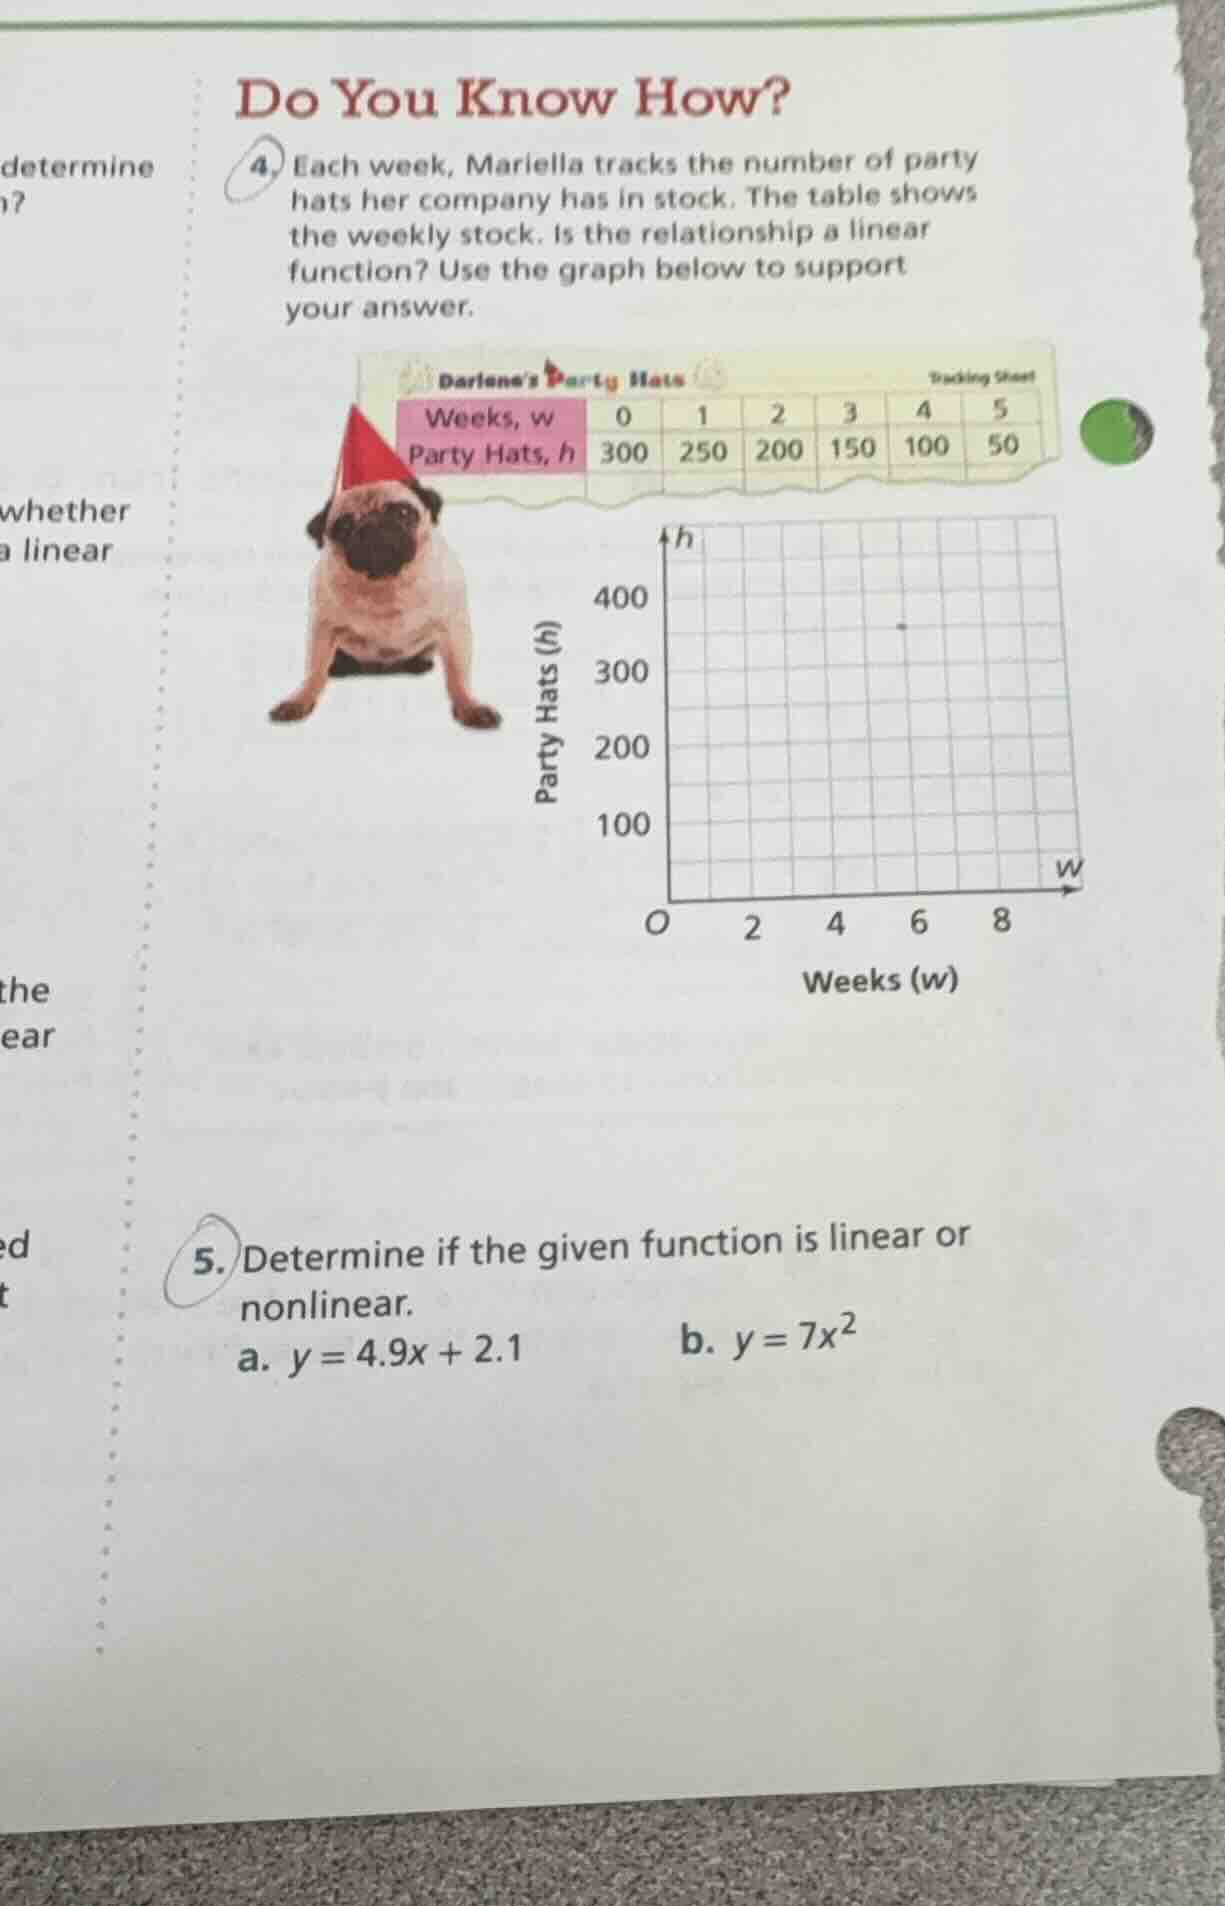
- each week, mariella tracks the number of party hats her company has in stock. the table shows the weekly stock. is the relationship a linear function? use the graph below to support your answer.
darlenes party hats tracking sheet
weeks, w: 0, 1, 2, 3, 4, 5
party hats, h: 300, 250, 200, 150, 100, 50
- determine if the given function is linear or nonlinear.
a. $y = 4.9x + 2.1$ b. $y = 7x^2$
Question 4
Step1: Recall linear function definition
A linear function has a constant rate of change (slope) and can be written as \( h = mw + b \), where \( m \) (slope) is constant. Calculate the rate of change between consecutive weeks.
For \( w = 0 \) to \( w = 1 \): \( \frac{250 - 300}{1 - 0} = -50 \)
For \( w = 1 \) to \( w = 2 \): \( \frac{200 - 250}{2 - 1} = -50 \)
For \( w = 2 \) to \( w = 3 \): \( \frac{150 - 200}{3 - 2} = -50 \)
For \( w = 3 \) to \( w = 4 \): \( \frac{100 - 150}{4 - 3} = -50 \)
For \( w = 4 \) to \( w = 5 \): \( \frac{50 - 100}{5 - 4} = -50 \)
Step2: Analyze the graph
Plotting the points \((0, 300)\), \((1, 250)\), \((2, 200)\), \((3, 150)\), \((4, 100)\), \((5, 50)\) on the graph, they lie on a straight line (since slope is constant at \(-50\)).
Step1: Recall linear function form
A linear function is in the form \( y = mx + b \), where \( m \) (slope) and \( b \) (y - intercept) are constants, and the highest power of \( x \) is 1.
The function \( y = 4.9x + 2.1 \) is in the form \( y = mx + b \) with \( m = 4.9 \) and \( b = 2.1 \), and the power of \( x \) is 1.
Step1: Recall nonlinear function form
A nonlinear function does not have a constant rate of change and the highest power of the variable is not 1. For \( y = 7x^2 \), the highest power of \( x \) is 2 (quadratic term), so it does not follow the linear form \( y = mx + b \).

Snap & solve any problem in the app
Get step-by-step solutions on Sovi AI
Photo-based solutions with guided steps
Explore more problems and detailed explanations
The relationship is a linear function. The rate of change between each pair of consecutive weeks is constant (\(-50\) party hats per week), and the plotted points lie on a straight line, confirming it is a linear function.