QUESTION IMAGE
Question
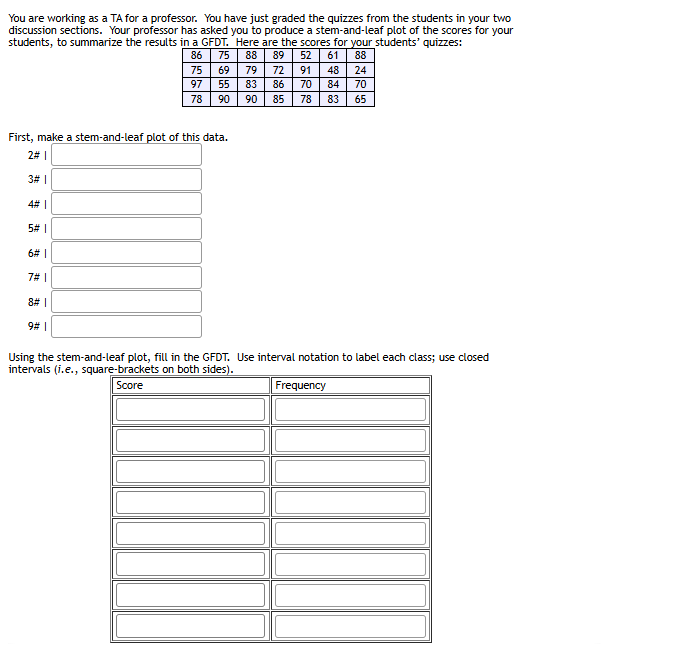
you are working as a ta for a professor. you have just graded the quizzes from the students in your two discussion sections. your professor has asked you to produce a stem-and-leaf plot of the scores for your students, to summarize the results in a gfdt. here are the scores for your students quizzes: 65 75 59 79 72 91 48 24 97 55 83 36 70 84 70 78 90 90 85 78 83 65 first, make a stem-and-leaf plot of this data. 2# | 3# | 4# | 5# | 6# | 7# | 8# | 9# | using the stem-and-leaf plot, fill in the gfdt. use interval notation to label each class; use closed intervals (i.e., square-brackets on both sides). score frequency
Part 1: Stem - and - Leaf Plot
Step 1: Organize the data by stems (tens place)
First, we list out all the scores: 45, 75, 75, 98, 90, 97, 55, 83, 76, 70, 84, 70, 75, 59, 79, 72, 91, 48, 94, 78, 90, 90, 85, 78, 83, 65.
- Stem 2: No scores in the 20s.
- Stem 3: No scores in the 30s.
- Stem 4: Scores are 45, 48. So leaves: 5, 8.
- Stem 5: Scores are 55, 59. So leaves: 5, 9.
- Stem 6: Score is 65. So leaf: 5.
- Stem 7: Scores are 75, 75, 76, 70, 70, 75, 79, 72, 78, 78. So leaves: 0, 0, 2, 5, 5, 5, 6, 8, 8, 9.
- Stem 8: Scores are 83, 84, 85, 83. So leaves: 3, 3, 4, 5.
- Stem 9: Scores are 98, 90, 97, 91, 94, 90, 90. So leaves: 0, 0, 0, 1, 4, 7, 8.
So the stem - and - leaf plot is:
2# |
3# |
4# | 5, 8
5# | 5, 9
6# | 5
7# | 0, 0, 2, 5, 5, 5, 6, 8, 8, 9
8# | 3, 3, 4, 5
9# | 0, 0, 0, 1, 4, 7, 8
Part 2: Grouped Frequency Distribution Table (GFDT)
Step 1: Determine the class intervals
The minimum score is 45 and the maximum score is 98. We can use class intervals with a width of 10 (since the stems are in tens). The class intervals will be:
- [40, 49]
- [50, 59]
- [60, 69]
- [70, 79]
- [80, 89]
- [90, 99]
Step 2: Calculate the frequency for each class
- For [40, 49]: Scores are 45, 48. Frequency = 2.
- For [50, 59]: Scores are 55, 59. Frequency = 2.
- For [60, 69]: Score is 65. Frequency = 1.
- For [70, 79]: Scores are 75, 75, 76, 70, 70, 75, 79, 72, 78, 78. Count them: 10. Frequency = 10.
- For [80, 89]: Scores are 83, 84, 85, 83. Count them: 4. Frequency = 4.
- For [90, 99]: Scores are 98, 90, 97, 91, 94, 90, 90. Count them: 7. Frequency = 7.
The GFDT is:
| Score | Frequency |
|---|---|
| [50, 59] | 2 |
| [60, 69] | 1 |
| [70, 79] | 10 |
| [80, 89] | 4 |
| [90, 99] | 7 |

Snap & solve any problem in the app
Get step-by-step solutions on Sovi AI
Photo-based solutions with guided steps
Explore more problems and detailed explanations
Part 1: Stem - and - Leaf Plot
Step 1: Organize the data by stems (tens place)
First, we list out all the scores: 45, 75, 75, 98, 90, 97, 55, 83, 76, 70, 84, 70, 75, 59, 79, 72, 91, 48, 94, 78, 90, 90, 85, 78, 83, 65.
- Stem 2: No scores in the 20s.
- Stem 3: No scores in the 30s.
- Stem 4: Scores are 45, 48. So leaves: 5, 8.
- Stem 5: Scores are 55, 59. So leaves: 5, 9.
- Stem 6: Score is 65. So leaf: 5.
- Stem 7: Scores are 75, 75, 76, 70, 70, 75, 79, 72, 78, 78. So leaves: 0, 0, 2, 5, 5, 5, 6, 8, 8, 9.
- Stem 8: Scores are 83, 84, 85, 83. So leaves: 3, 3, 4, 5.
- Stem 9: Scores are 98, 90, 97, 91, 94, 90, 90. So leaves: 0, 0, 0, 1, 4, 7, 8.
So the stem - and - leaf plot is:
2# |
3# |
4# | 5, 8
5# | 5, 9
6# | 5
7# | 0, 0, 2, 5, 5, 5, 6, 8, 8, 9
8# | 3, 3, 4, 5
9# | 0, 0, 0, 1, 4, 7, 8
Part 2: Grouped Frequency Distribution Table (GFDT)
Step 1: Determine the class intervals
The minimum score is 45 and the maximum score is 98. We can use class intervals with a width of 10 (since the stems are in tens). The class intervals will be:
- [40, 49]
- [50, 59]
- [60, 69]
- [70, 79]
- [80, 89]
- [90, 99]
Step 2: Calculate the frequency for each class
- For [40, 49]: Scores are 45, 48. Frequency = 2.
- For [50, 59]: Scores are 55, 59. Frequency = 2.
- For [60, 69]: Score is 65. Frequency = 1.
- For [70, 79]: Scores are 75, 75, 76, 70, 70, 75, 79, 72, 78, 78. Count them: 10. Frequency = 10.
- For [80, 89]: Scores are 83, 84, 85, 83. Count them: 4. Frequency = 4.
- For [90, 99]: Scores are 98, 90, 97, 91, 94, 90, 90. Count them: 7. Frequency = 7.
The GFDT is:
| Score | Frequency |
|---|---|
| [50, 59] | 2 |
| [60, 69] | 1 |
| [70, 79] | 10 |
| [80, 89] | 4 |
| [90, 99] | 7 |