QUESTION IMAGE
Question
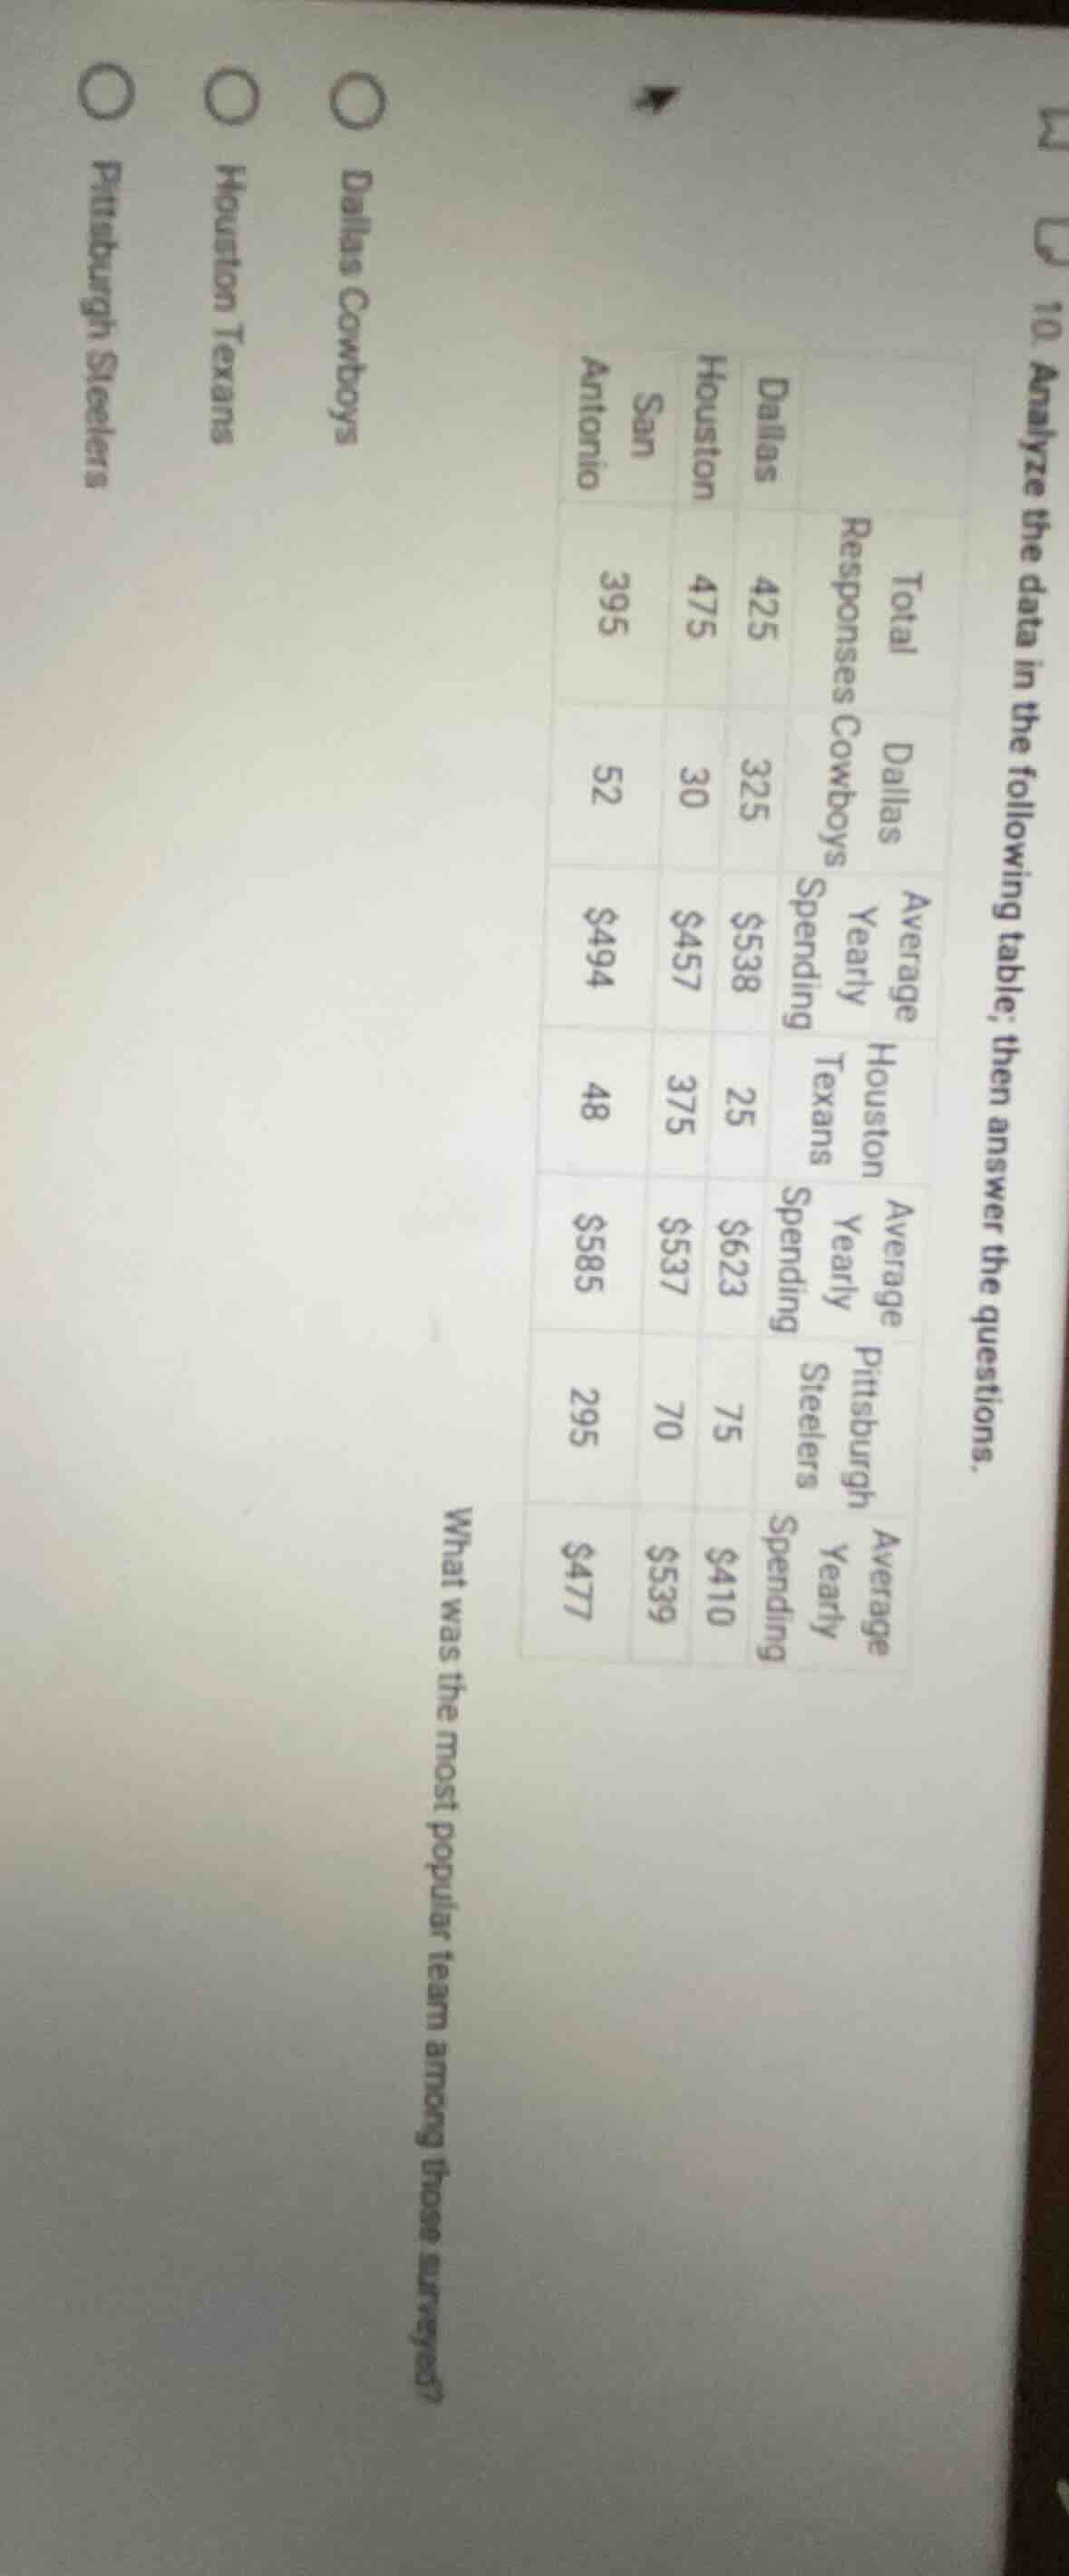
- analyze the data in the following table; then answer the questions.
| dallas | houston | san antonio | |
|---|---|---|---|
| dallas cowboys | 325 | 30 | 52 |
| average yearly spending | $538 | $457 | $494 |
| houston texans | 25 | 375 | 48 |
| average yearly spending | $623 | $537 | $585 |
| pittsburgh steelers | 75 | 70 | 295 |
| average yearly spending | $410 | $539 | $477 |
what was the most popular team among those surveyed?
○ dallas cowboys
○ houston texans
○ pittsburgh steelers
Step1: Sum team responses per city
Dallas Cowboys: $325 + 30 + 52 = 407$
Houston Texans: $25 + 375 + 48 = 448$
Pittsburgh Steelers: $75 + 70 + 295 = 440$
Step2: Compare total responses
$448 > 440 > 407$

Snap & solve any problem in the app
Get step-by-step solutions on Sovi AI
Photo-based solutions with guided steps
Explore more problems and detailed explanations
Houston Texans