QUESTION IMAGE
Question
- choose the best answer.
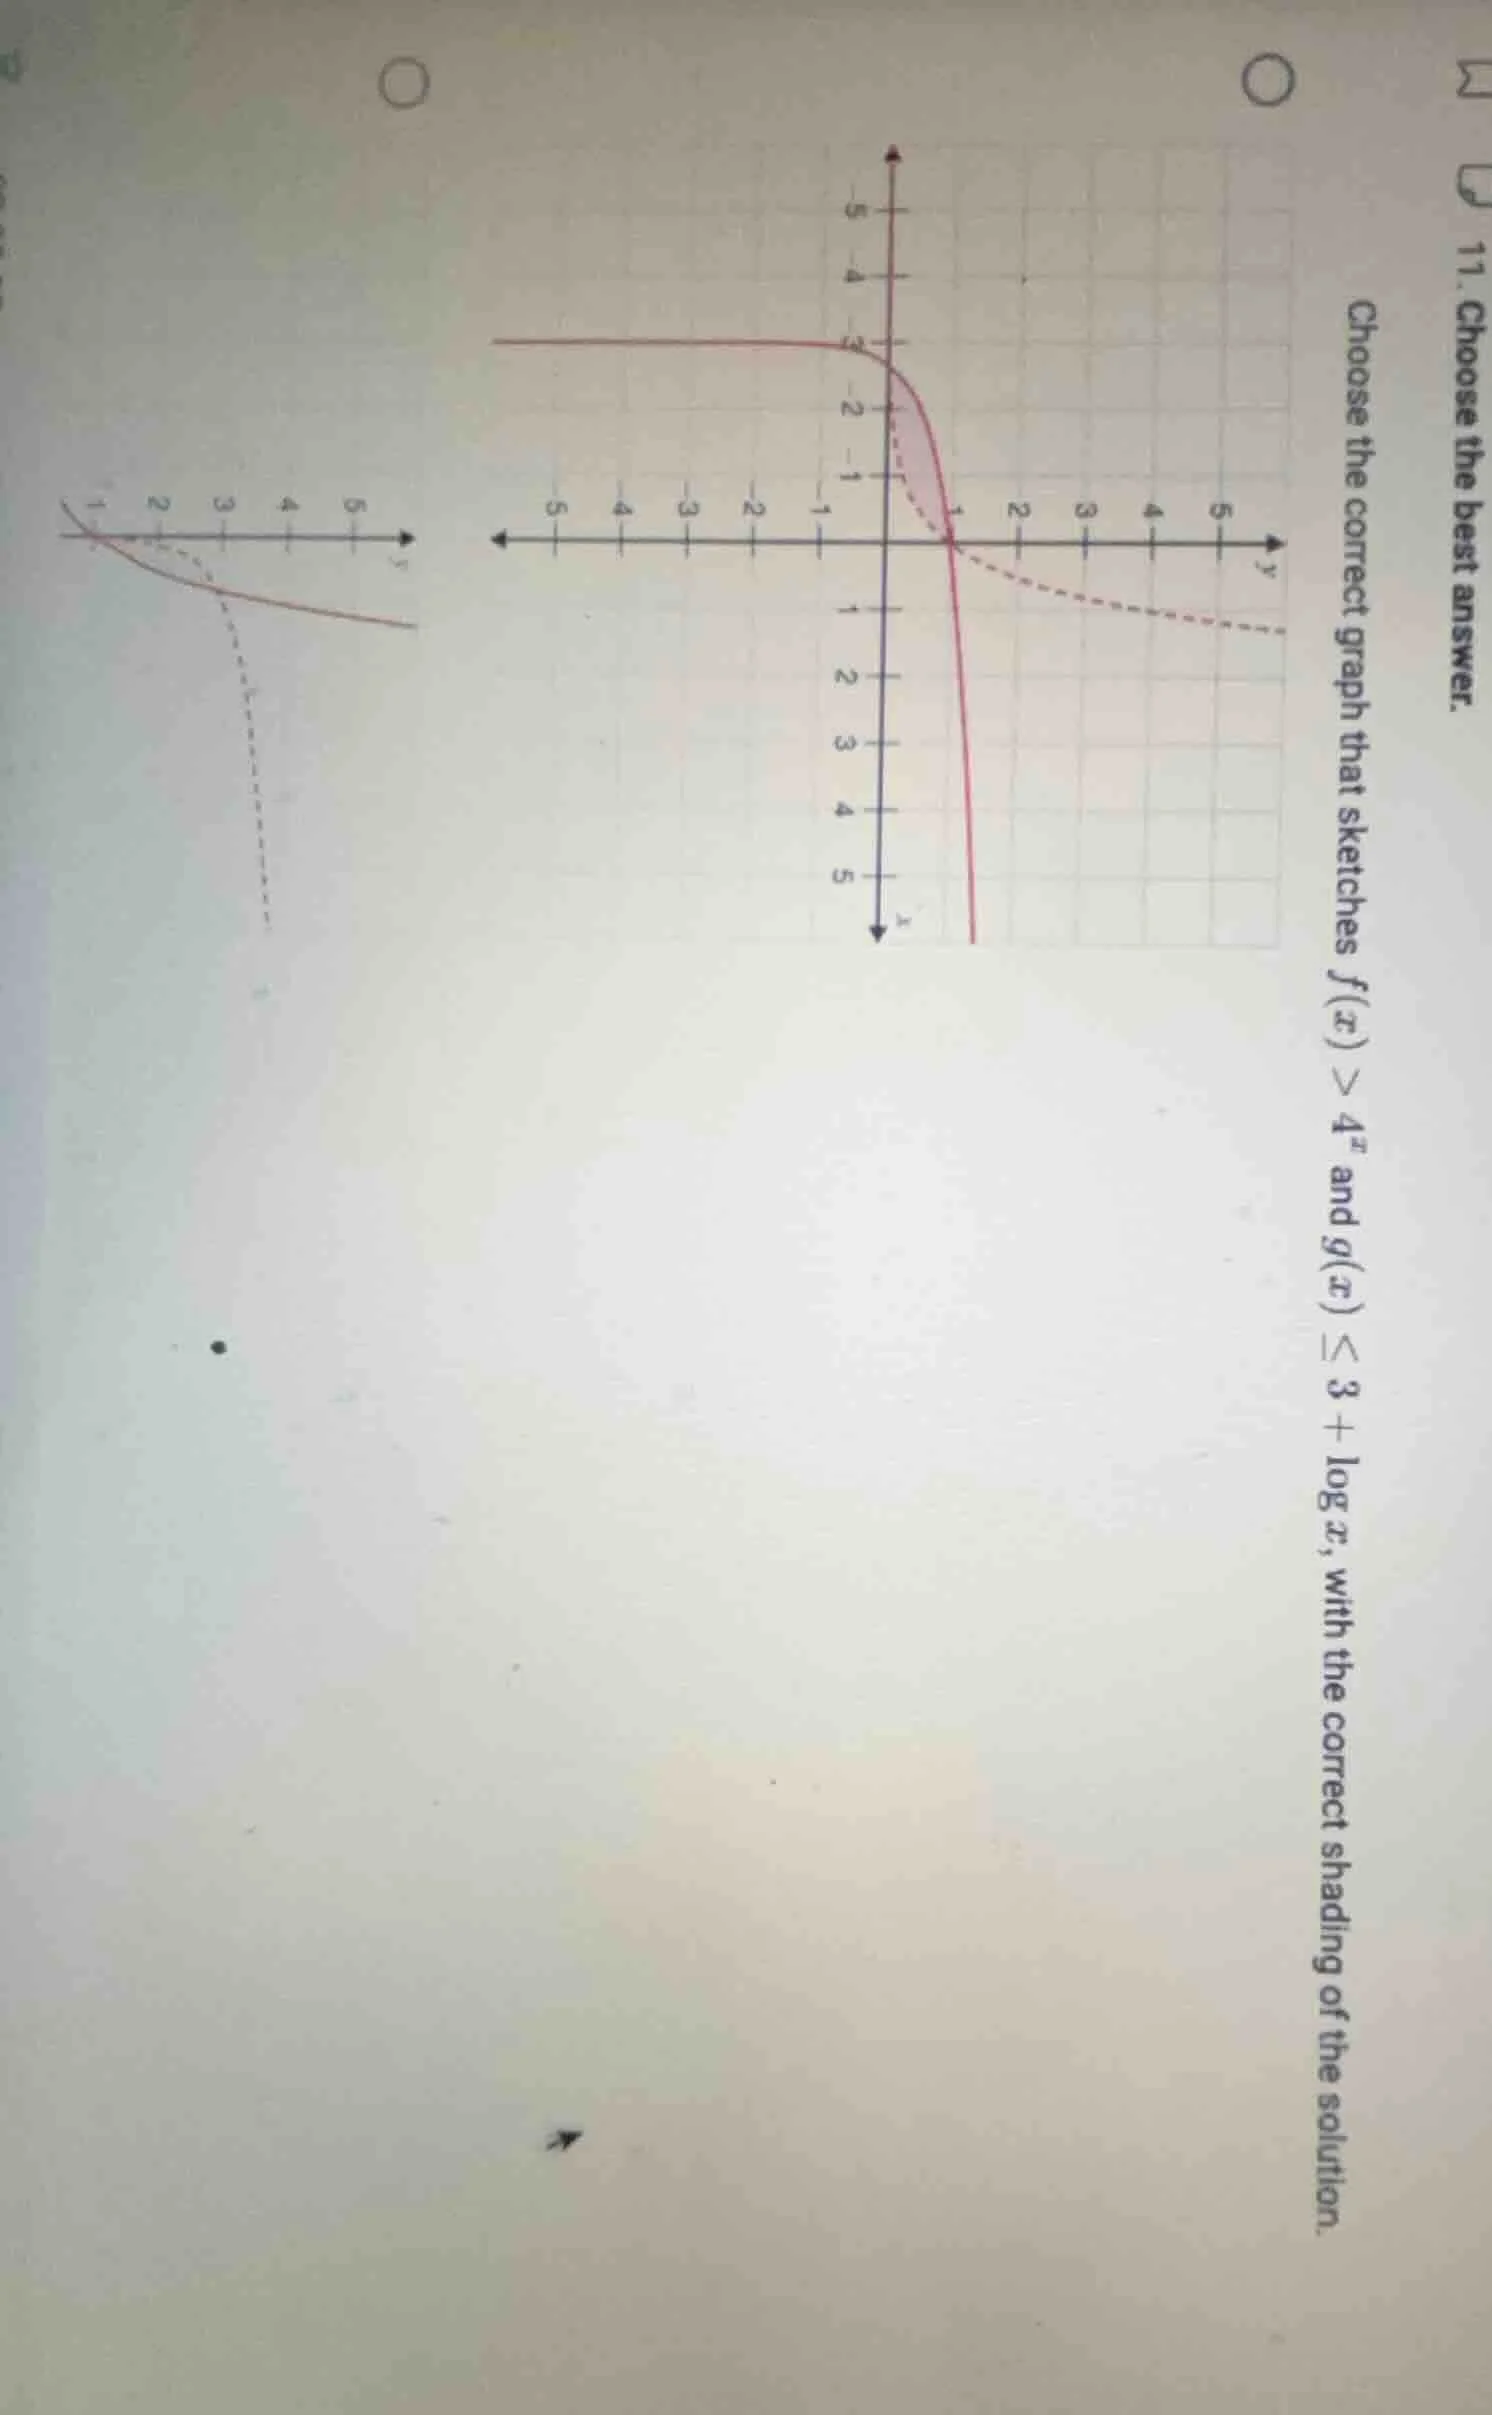
choose the correct graph that sketches $f(x) > 4^{x}$ and $g(x) \leq 3+\log x$, with the correct shading of the solution.
Brief Explanations
- For $f(x) > 4^x$: First, identify the graph of $y=4^x$ (an exponential growth curve passing through $(0,1)$). The inequality $f(x) > 4^x$ represents the region above this curve, and since it is a strict inequality ($>$), the curve itself should be dashed.
- For $g(x) \leq 3 + \log x$: Identify the graph of $y=3+\log x$ (a logarithmic curve shifted up 3 units, defined only for $x>0$). The inequality $g(x) \leq 3 + \log x$ represents the region below or on this curve, and since it is a non-strict inequality ($\leq$), the curve itself should be solid.
- Match these criteria to the given graphs: the graph in the top-right (with the dashed exponential curve and shaded region above it, and solid logarithmic curve with shaded region below it) fits both conditions.

Snap & solve any problem in the app
Get step-by-step solutions on Sovi AI
Photo-based solutions with guided steps
Explore more problems and detailed explanations
The correct graph is the top-right option (with dashed curve $y=4^x$, shading above it; solid curve $y=3+\log x$, shading below it, with overlapping shaded region as the solution set).