QUESTION IMAGE
Question
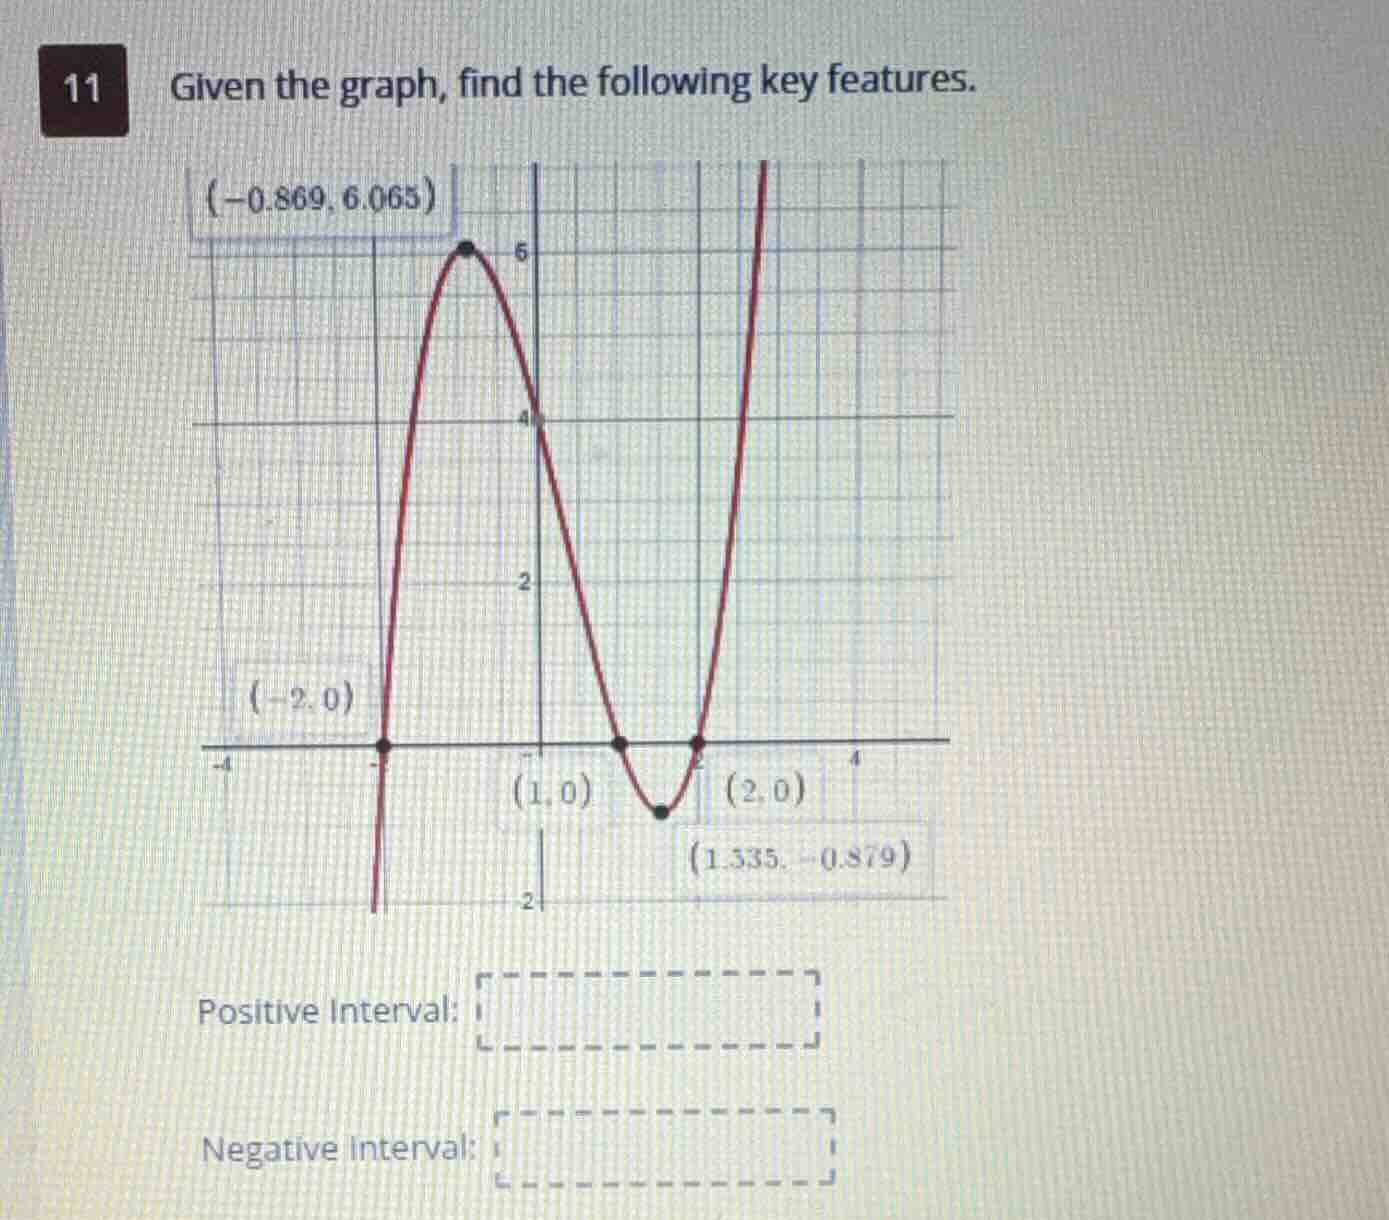
11 given the graph, find the following key features.
positive interval:
negative interval:
Step1: Identify positive intervals
The graph is above the x-axis (positive) when \(x < -2\) or \(1 < x < 2\) is not correct, recheck: graph is positive where \(y>0\): left of \(x=-2\), and between \(x=1\) and \(x=2\) is not, wait no: look at intercepts: (-2,0), (1,0), (2,0). The graph is above x-axis when \(x \in (-\infty, -2) \cup (1, 2)\)? No, wait the peak at (-0.869,6.065) is positive, so between -2 and 1, the graph is positive. Correct: positive when \(x < -2\) is negative? No, left of x=-2, the graph goes down to negative, wait no: at x=-3, the graph is below x-axis? Wait no, the graph crosses x=-2 from below to above: so left of -2, y<0, between -2 and 1, y>0, between 1 and 2, y<0, right of 2, y>0.
Step1: Locate positive \(y\) regions
Graph is positive (\(y>0\)) when \(x \in (-2, 1) \cup (2, \infty)\)
Step2: Locate negative \(y\) regions
Graph is negative (\(y<0\)) when \(x \in (-\infty, -2) \cup (1, 2)\)

Snap & solve any problem in the app
Get step-by-step solutions on Sovi AI
Photo-based solutions with guided steps
Explore more problems and detailed explanations
Positive Interval: \(\boldsymbol{(-2, 1) \cup (2, \infty)}\)
Negative Interval: \(\boldsymbol{(-\infty, -2) \cup (1, 2)}\)