QUESTION IMAGE
Question
- fill in the blanks:
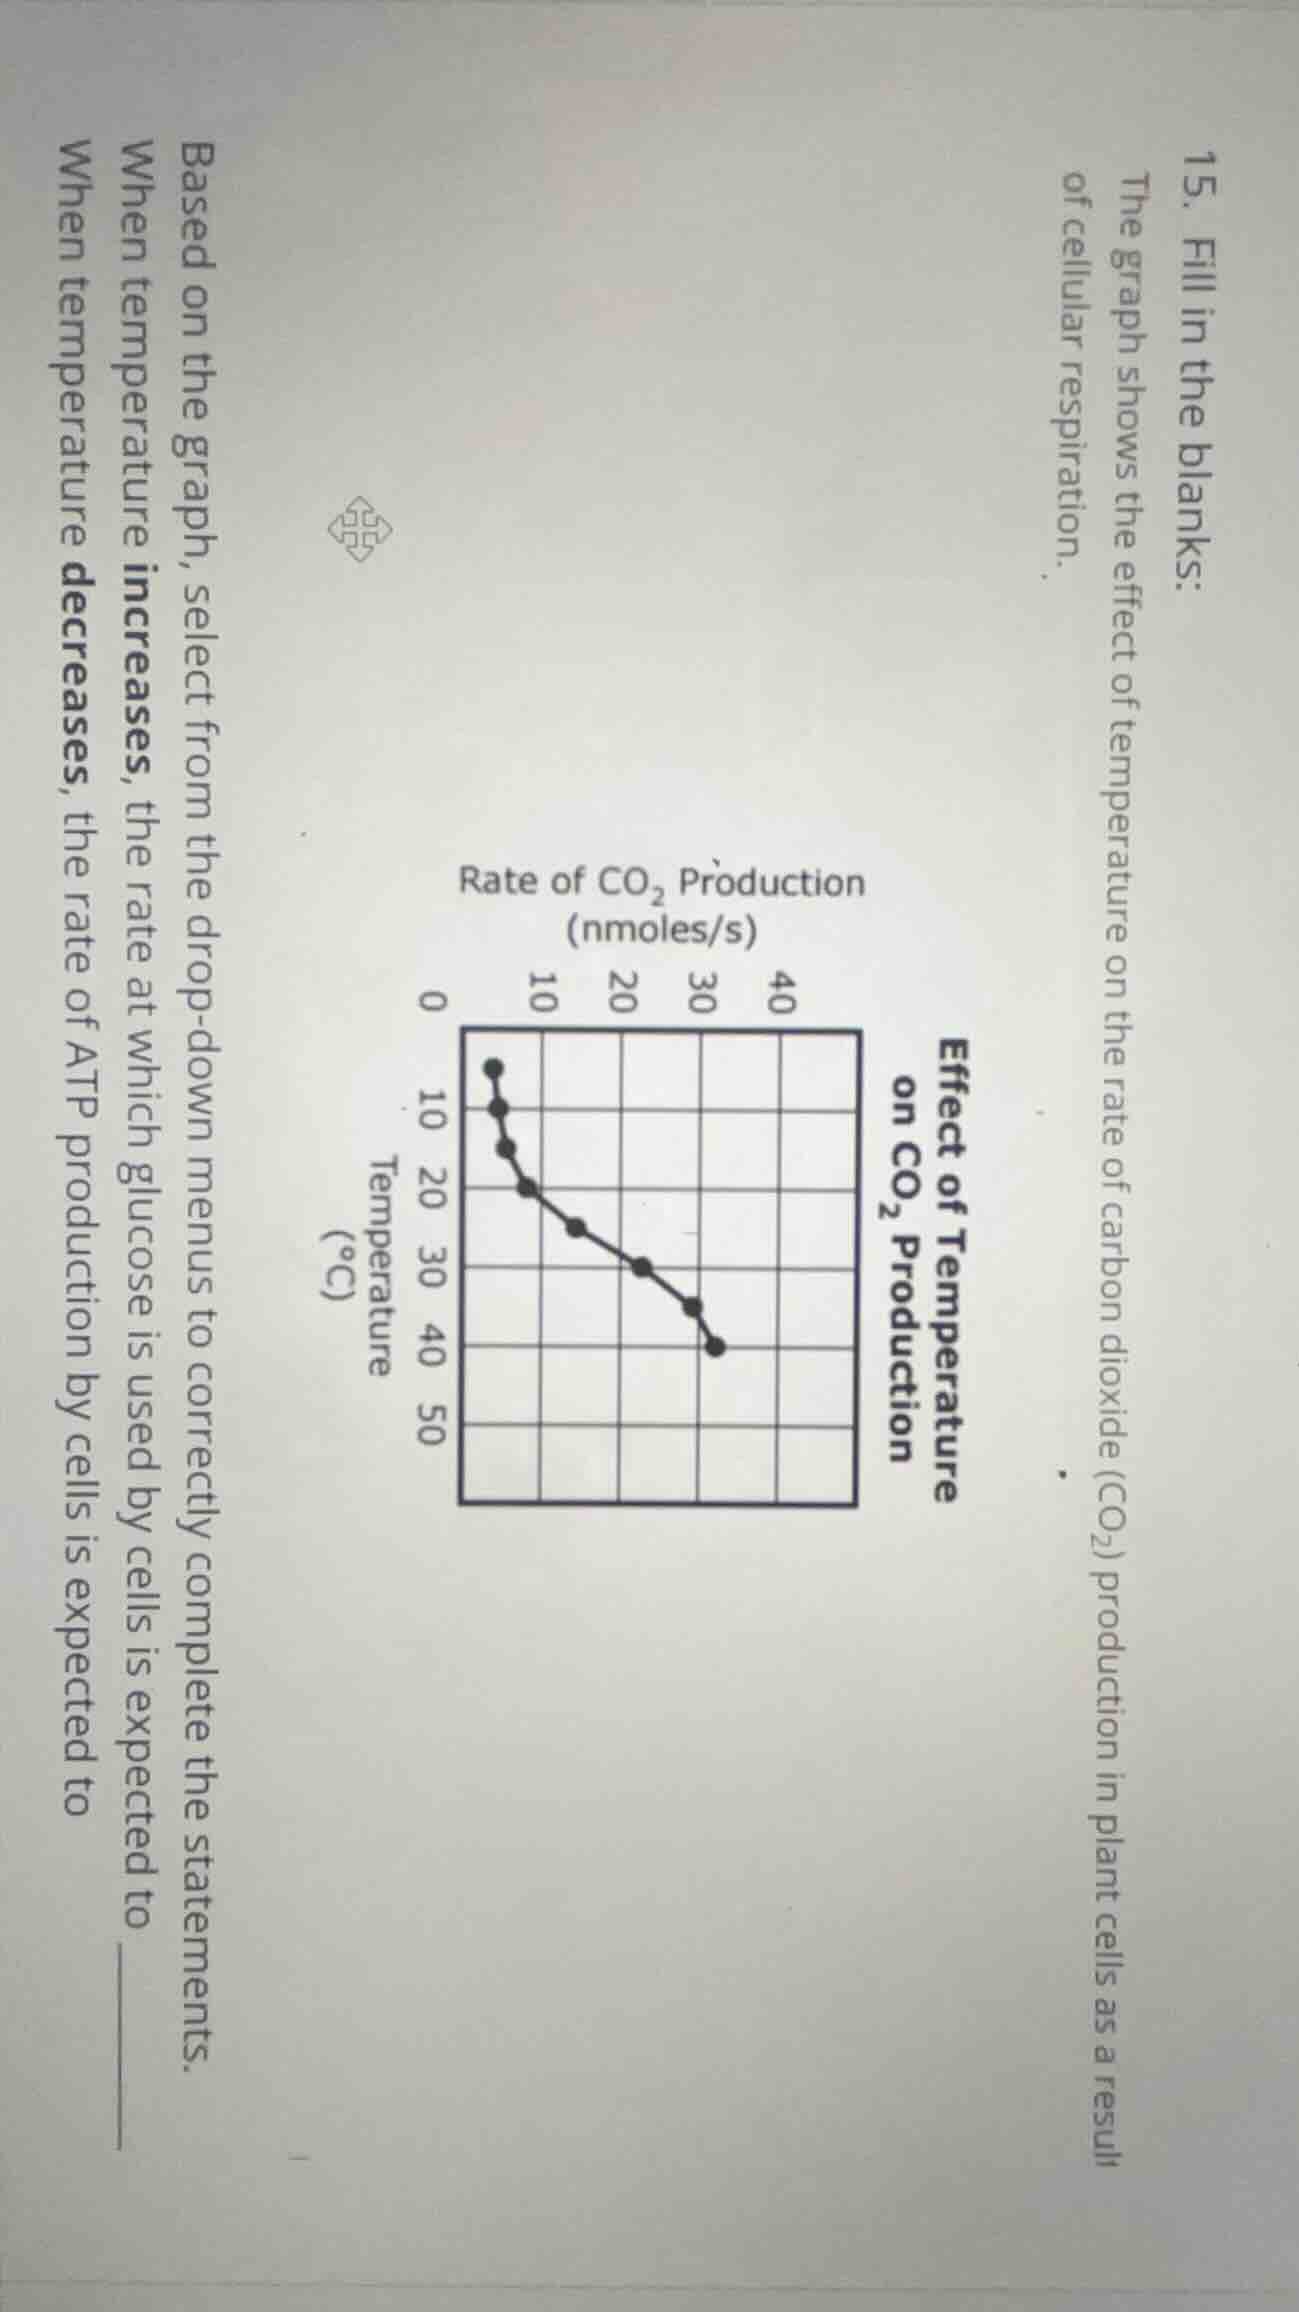
the graph shows the effect of temperature on the rate of carbon dioxide (co₂) production in plant cells as a result of cellular respiration.
rate of co₂ production (nmoles/s)
effect of temperature on co₂ production
based on the graph, select from the drop-down menus to correctly complete the statements.
when temperature increases, the rate at which glucose is used by cells is expected to ________
when temperature decreases, the rate of atp production by cells is expected to ________
- The graph shows that as temperature increases, the rate of CO₂ production (a byproduct of cellular respiration) decreases. Since glucose is broken down in cellular respiration to produce CO₂ and ATP, a lower rate of CO₂ production means less glucose is being used by the cell.
- When temperature decreases, the graph shows the rate of CO₂ production increases. A higher rate of cellular respiration (indicated by more CO₂ production) means more ATP is being generated by the cells.

Snap & solve any problem in the app
Get step-by-step solutions on Sovi AI
Photo-based solutions with guided steps
Explore more problems and detailed explanations
When temperature increases, the rate at which glucose is used by cells is expected to decrease
When temperature decreases, the rate of ATP production by cells is expected to increase