QUESTION IMAGE
Question
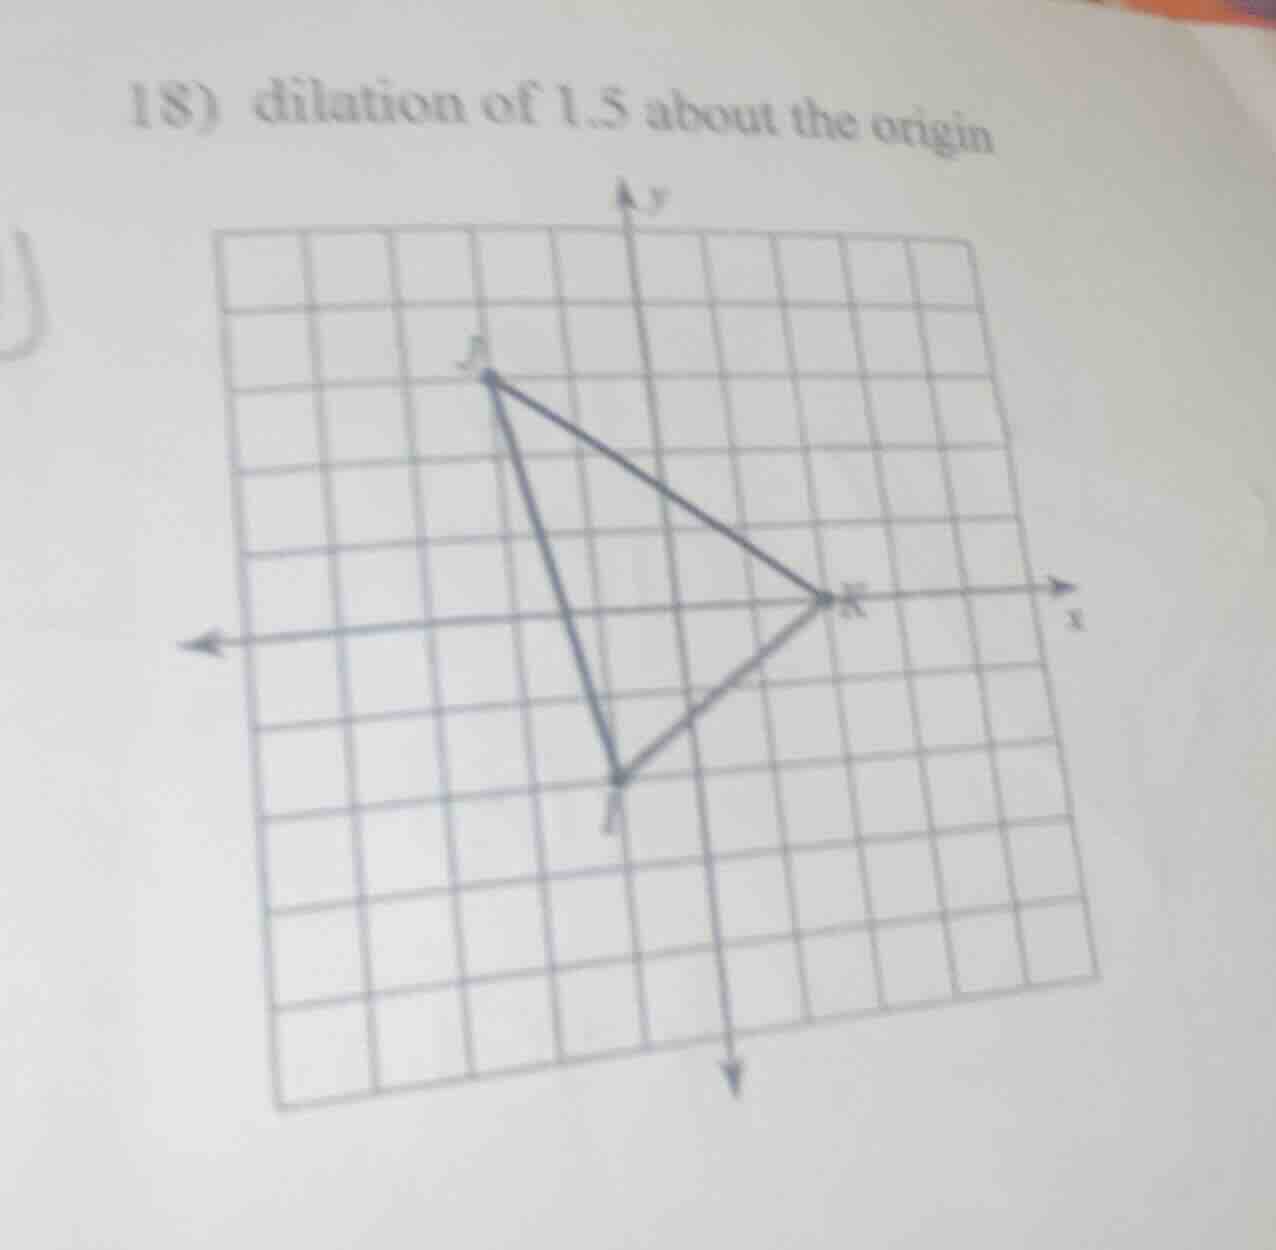
- dilation of 1.5 about the origin
Step1: Identify coordinates of vertices
First, we find the coordinates of the vertices of the triangle. Let's assume the grid has each square with side length 1. From the graph:
- Let's say point \( J \) is at \( (-2, 3) \) (wait, no, looking at the grid, let's re - check. Wait, maybe \( J \) is at \( (-2, 3) \)? Wait, no, let's look again. Wait, the x - axis and y - axis: Let's find the coordinates properly. Let's assume the origin is \( (0,0) \). Let's find the coordinates of \( J \), \( K \), and \( L \) (the third vertex).
Wait, from the graph, let's suppose:
- Point \( J \): Let's count the grid. If we move left 2 units from the y - axis and up 3 units from the x - axis, \( J=(-2,3) \)
- Point \( K \): Let's say it's at \( (3,0) \) (3 units right on x - axis, 0 on y - axis)
- Point \( L \): Let's say it's at \( (0, - 1) \) (0 on x - axis, 1 unit down on y - axis)
Step2: Apply dilation about the origin
The rule for dilation about the origin with a scale factor \( k \) is \( (x,y)\to(kx,ky) \). Here, \( k = 1.5=\frac{3}{2} \)
For point \( J(-2,3) \):
New \( x \) - coordinate: \( 1.5\times(-2)=-3 \)
New \( y \) - coordinate: \( 1.5\times3 = 4.5 \)
So, \( J'=(-3,4.5) \)
For point \( K(3,0) \):
New \( x \) - coordinate: \( 1.5\times3=4.5 \)
New \( y \) - coordinate: \( 1.5\times0 = 0 \)
So, \( K'=(4.5,0) \)
For point \( L(0,-1) \):
New \( x \) - coordinate: \( 1.5\times0 = 0 \)
New \( y \) - coordinate: \( 1.5\times(-1)=-1.5 \)
So, \( L'=(0, - 1.5) \)
Step3: Plot the new points
After finding the new coordinates \( J'(-3,4.5) \), \( K'(4.5,0) \), and \( L'(0,-1.5) \), we plot these points on the coordinate plane and connect them to get the dilated triangle.

Snap & solve any problem in the app
Get step-by-step solutions on Sovi AI
Photo-based solutions with guided steps
Explore more problems and detailed explanations
The dilated triangle has vertices at \( J'(-3,4.5) \), \( K'(4.5,0) \), and \( L'(0,-1.5) \). To draw the dilated figure, plot these points and connect them. (Note: The actual plotting is done on the coordinate grid by marking these points and drawing the sides between them.)