QUESTION IMAGE
Question
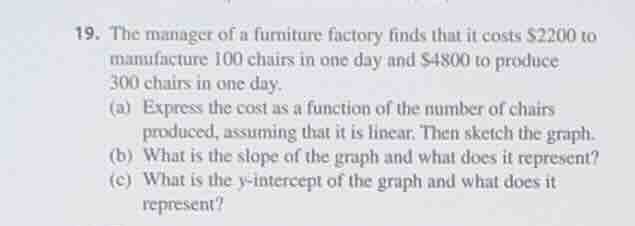
- the manager of a furniture factory finds that it costs $2200 to manufacture 100 chairs in one day and $4800 to produce 300 chairs in one day.
(a) express the cost as a function of the number of chairs produced, assuming that it is linear. then sketch the graph.
(b) what is the slope of the graph and what does it represent?
(c) what is the y-intercept of the graph and what does it represent?
Step1: Define variables and points
Let $x$ = number of chairs, $C(x)$ = total cost.
Points: $(100, 2200)$ and $(300, 4800)$
Step2: Calculate slope $m$
Slope = $\frac{\text{Change in cost}}{\text{Change in chairs}}$
$m = \frac{4800 - 2200}{300 - 100} = \frac{2600}{200} = 13$
Step3: Find y-intercept $b$
Use $C(x) = mx + b$ and $(100, 2200)$:
$2200 = 13(100) + b$
$2200 = 1300 + b$
$b = 2200 - 1300 = 900$
Step4: Form cost function
$C(x) = 13x + 900$
Step5: Interpret slope
Slope = 13, it is the marginal cost per chair.
Step6: Interpret y-intercept
y-intercept = 900, it is fixed daily cost.

Snap & solve any problem in the app
Get step-by-step solutions on Sovi AI
Photo-based solutions with guided steps
Explore more problems and detailed explanations
(a) The linear cost function is $C(x) = 13x + 900$. To sketch the graph: plot the points $(100, 2200)$ and $(300, 4800)$, then draw a straight line through them; the line will cross the y-axis at $(0, 900)$.
(b) The slope is 13. It represents the additional cost to produce one more chair (marginal cost per chair).
(c) The y-intercept is 900. It represents the fixed daily costs of running the factory (costs incurred even when 0 chairs are produced).