QUESTION IMAGE
Question
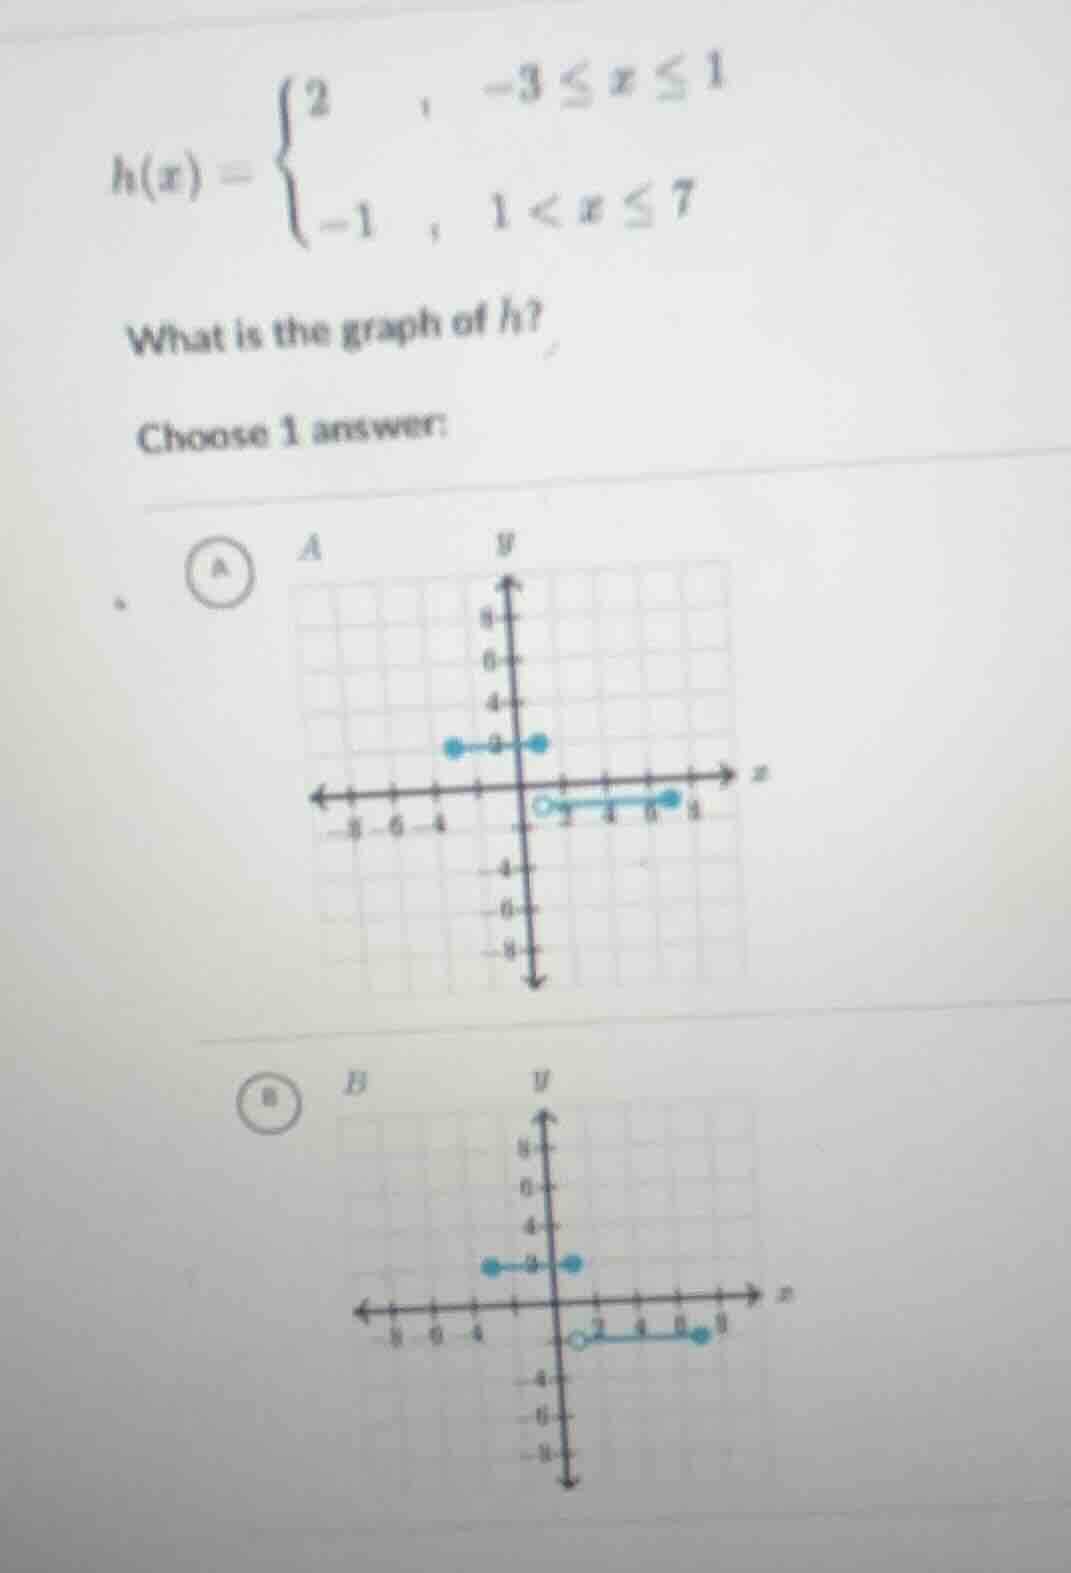
h(x) = \
what is the graph of h?
choose 1 answer:
a graph a
b graph b
Step1: Analyze the first piece of the function
For \( h(x) = 2 \) when \( -3 \leq x \leq 1 \), this is a horizontal line segment. The \( y \)-value is 2, and \( x \) ranges from -3 to 1 (inclusive). So we should have a line segment at \( y = 2 \) with endpoints at \( x=-3 \) (closed dot) and \( x = 1 \) (closed dot).
Step2: Analyze the second piece of the function
For \( h(x)=-1 \) when \( 1 < x \leq 7 \), this is a horizontal line segment. The \( y \)-value is -1, and \( x \) ranges from 1 (open dot, since \( x>1 \)) to 7 (closed dot). So we should have a line segment at \( y=-1 \) with an open dot at \( x = 1 \) and a closed dot at \( x=7 \).
Looking at the options, option B has the first segment at \( y = 2 \) (matching the \( y \)-value for \( -3 \leq x \leq 1 \)) and the second segment at \( y=-1 \) (matching the \( y \)-value for \( 1 < x \leq 7 \)) with the correct open and closed dots. Option A has the second segment at a different \( y \)-value (positive, but it should be -1).

Snap & solve any problem in the app
Get step-by-step solutions on Sovi AI
Photo-based solutions with guided steps
Explore more problems and detailed explanations
B