QUESTION IMAGE
Question
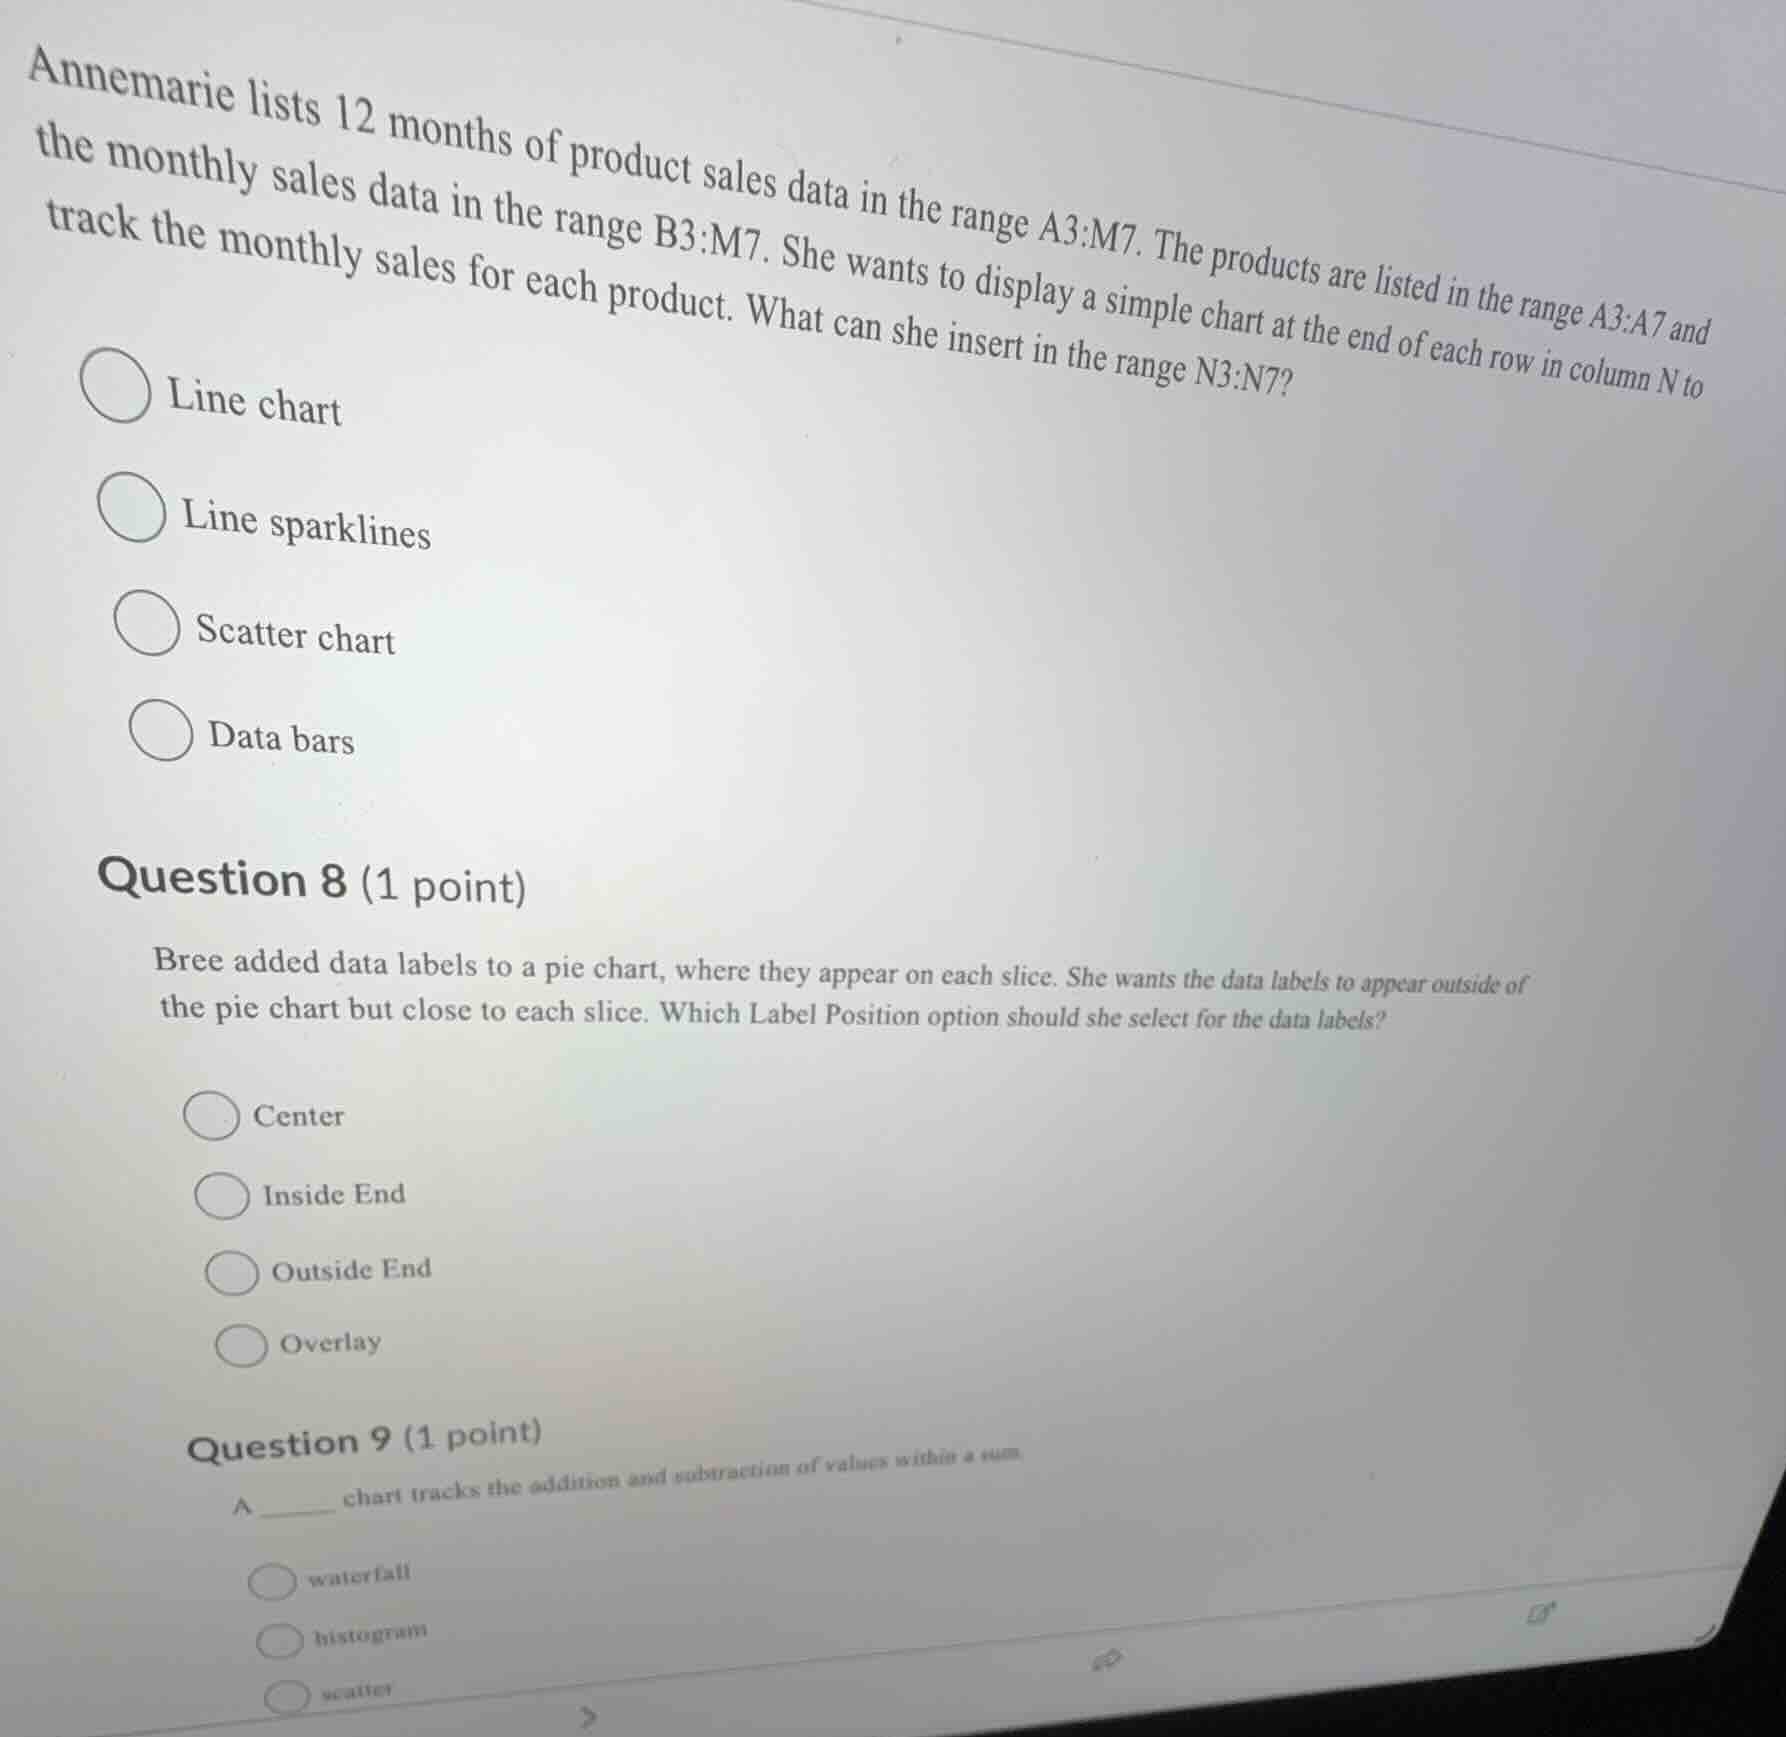
annemarie lists 12 months of product sales data in the range a3:m7. the products are listed in the range a3:a7 and the monthly sales data in the range b3:m7. she wants to display a simple chart at the end of each row in column n to track the monthly sales for each product. what can she insert in the range n3:n7? line chart line sparklines scatter chart data bars question 8 (1 point) bree added data labels to a pie chart, where they appear on each slice. she wants the data labels to appear outside of the pie chart but close to each slice. which label position option should she select for the data labels? center inside end outside end overlay question 9 (1 point) a ______ chart tracks the addition and subtraction of values within a sum waterfall histogram scatter
Question (Annemarie's Chart Choice)
Sparklines are small, simple charts in a single cell (or range like N3:N7) to show data trends. Line sparklines are ideal for tracking monthly sales (time - series) per product row. Line charts are larger, scatter charts show relationships, and data bars are for comparing values, not trend - tracking per row.
- "Center" puts labels in the middle of slices.
- "Inside End" puts labels inside slices near the edge.
- "Outside End" places labels outside the pie but close to slices, matching Bree's need.
- "Overlay" is not a standard pie chart label position for this purpose.
- A waterfall chart shows cumulative effect of positive/negative values (addition/subtraction in a sum).
- A histogram shows data distribution.
- A scatter chart shows variable relationships. So waterfall is correct.

Snap & solve any problem in the app
Get step-by-step solutions on Sovi AI
Photo-based solutions with guided steps
Explore more problems and detailed explanations
B. Line sparklines