QUESTION IMAGE
Question
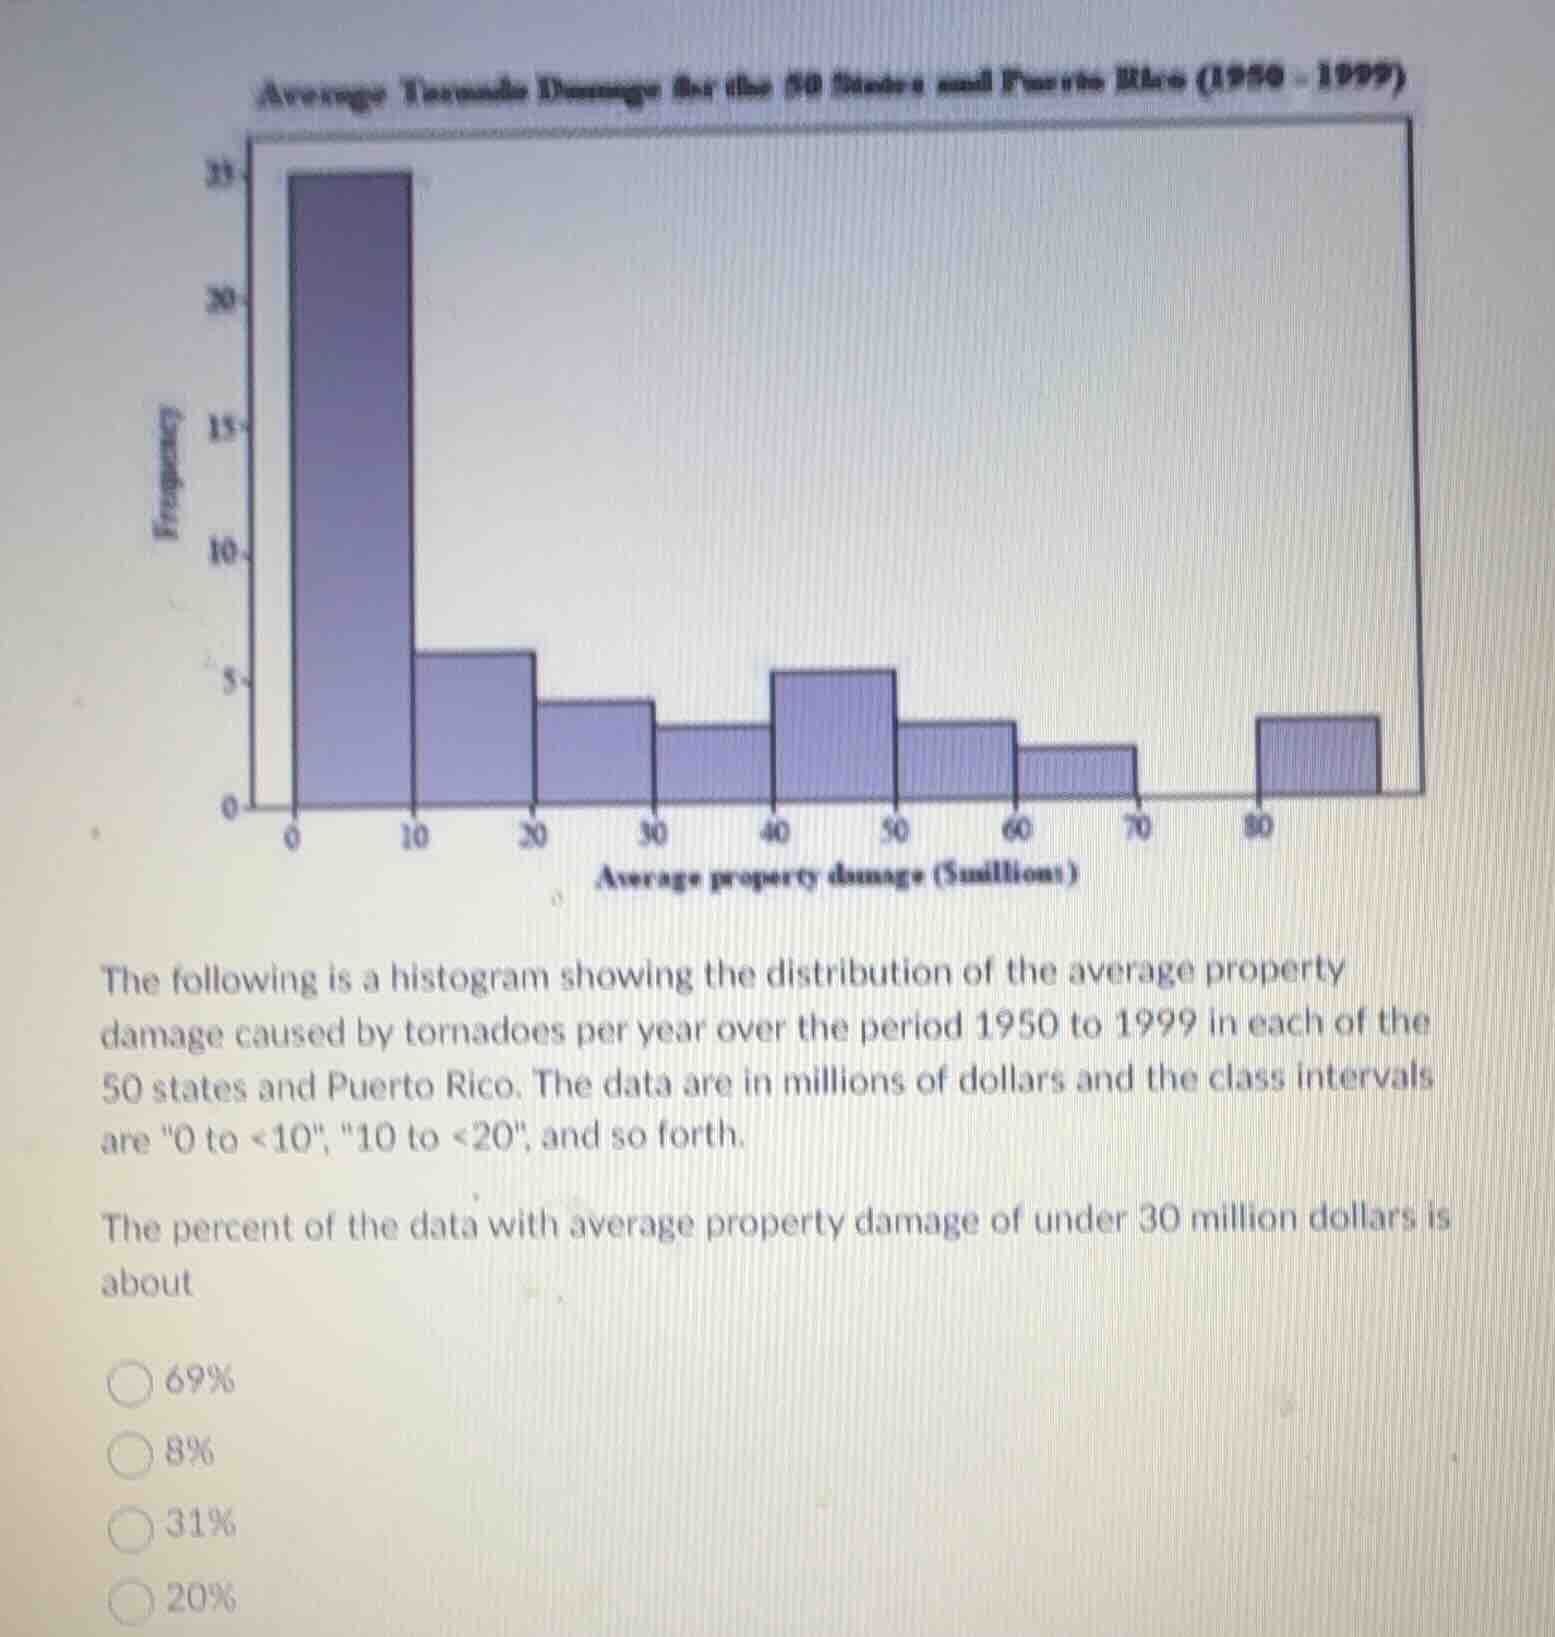
average tornado damage for the 50 states and puerto rico (1950 - 1999)
the following is a histogram showing the distribution of the average property damage caused by tornadoes per year over the period 1950 to 1999 in each of the 50 states and puerto rico. the data are in millions of dollars and the class intervals are \0 to <10\, \10 to <20\, and so forth.
the percent of the data with average property damage of under 30 million dollars is about
○ 69%
○ 8%
○ 31%
○ 20%
Step1: Count total frequency
First, we sum up all the frequencies from the histogram. Let's assume the frequencies for each interval: 0 - 10: 25, 10 - 20: 6, 20 - 30: 4, 30 - 40: 3, 40 - 50: 5, 50 - 60: 3, 60 - 70: 2, 80 - 90: 3 (approximate from the graph). Total frequency = 25 + 6 + 4 + 3 + 5 + 3 + 2 + 3 = 51 (approx).
Step2: Count frequency under 30
Frequency for 0 - 10, 10 - 20, 20 - 30: 25 + 6 + 4 = 35.
Step3: Calculate percentage
Percentage = (35 / 51) * 100 ≈ 68.6%, which is about 69%.

Snap & solve any problem in the app
Get step-by-step solutions on Sovi AI
Photo-based solutions with guided steps
Explore more problems and detailed explanations
69%