QUESTION IMAGE
Question
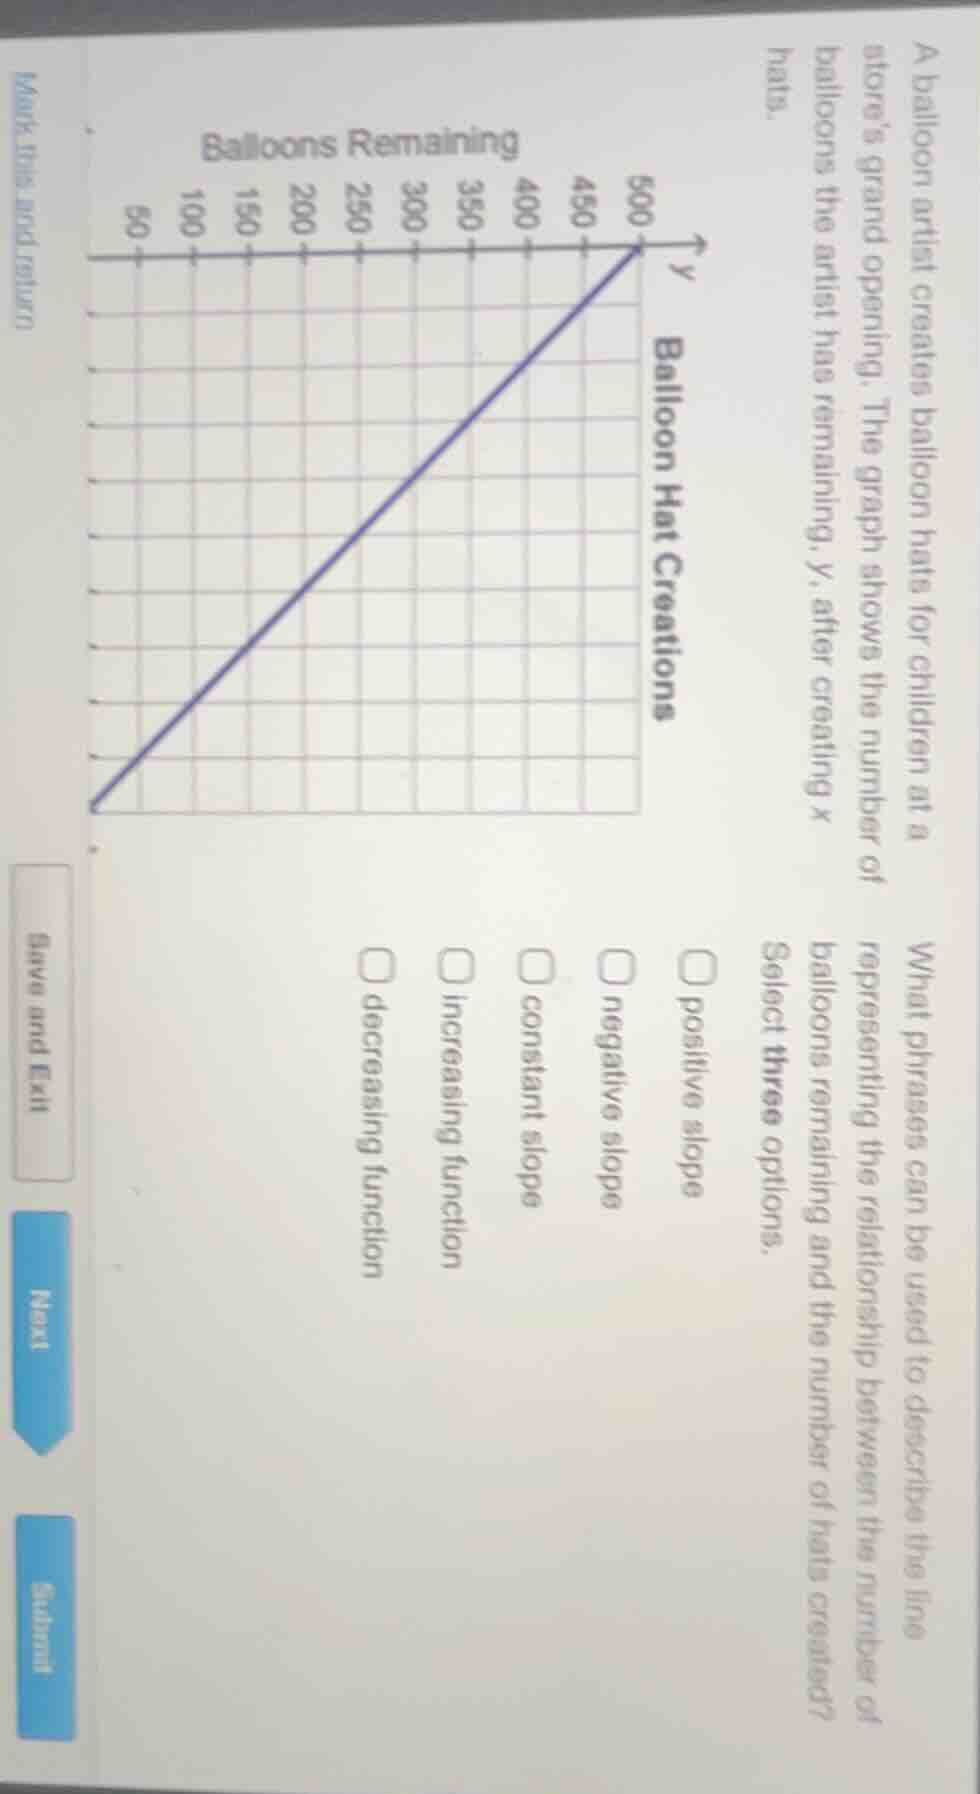
a balloon artist creates balloon hats for children at a store’s grand opening. the graph shows the number of balloons the artist has remaining, y, after creating x hats. what phrases can be used to describe the line representing the relationship between the number of balloons remaining and the number of hats created? select three options. positive slope negative slope constant slope increasing function decreasing function
Brief Explanations
- Slope sign: As the number of hats created ($x$) increases, the remaining balloons ($y$) decreases. This means the line falls from left to right, so it has a negative slope.
- Slope consistency: The graph is a straight line, so its slope is constant across all points.
- Function trend: Since $y$ (remaining balloons) decreases as $x$ (hats created) increases, the function is decreasing.

Snap & solve any problem in the app
Get step-by-step solutions on Sovi AI
Photo-based solutions with guided steps
Explore more problems and detailed explanations
- negative slope
- constant slope
- decreasing function