QUESTION IMAGE
Question
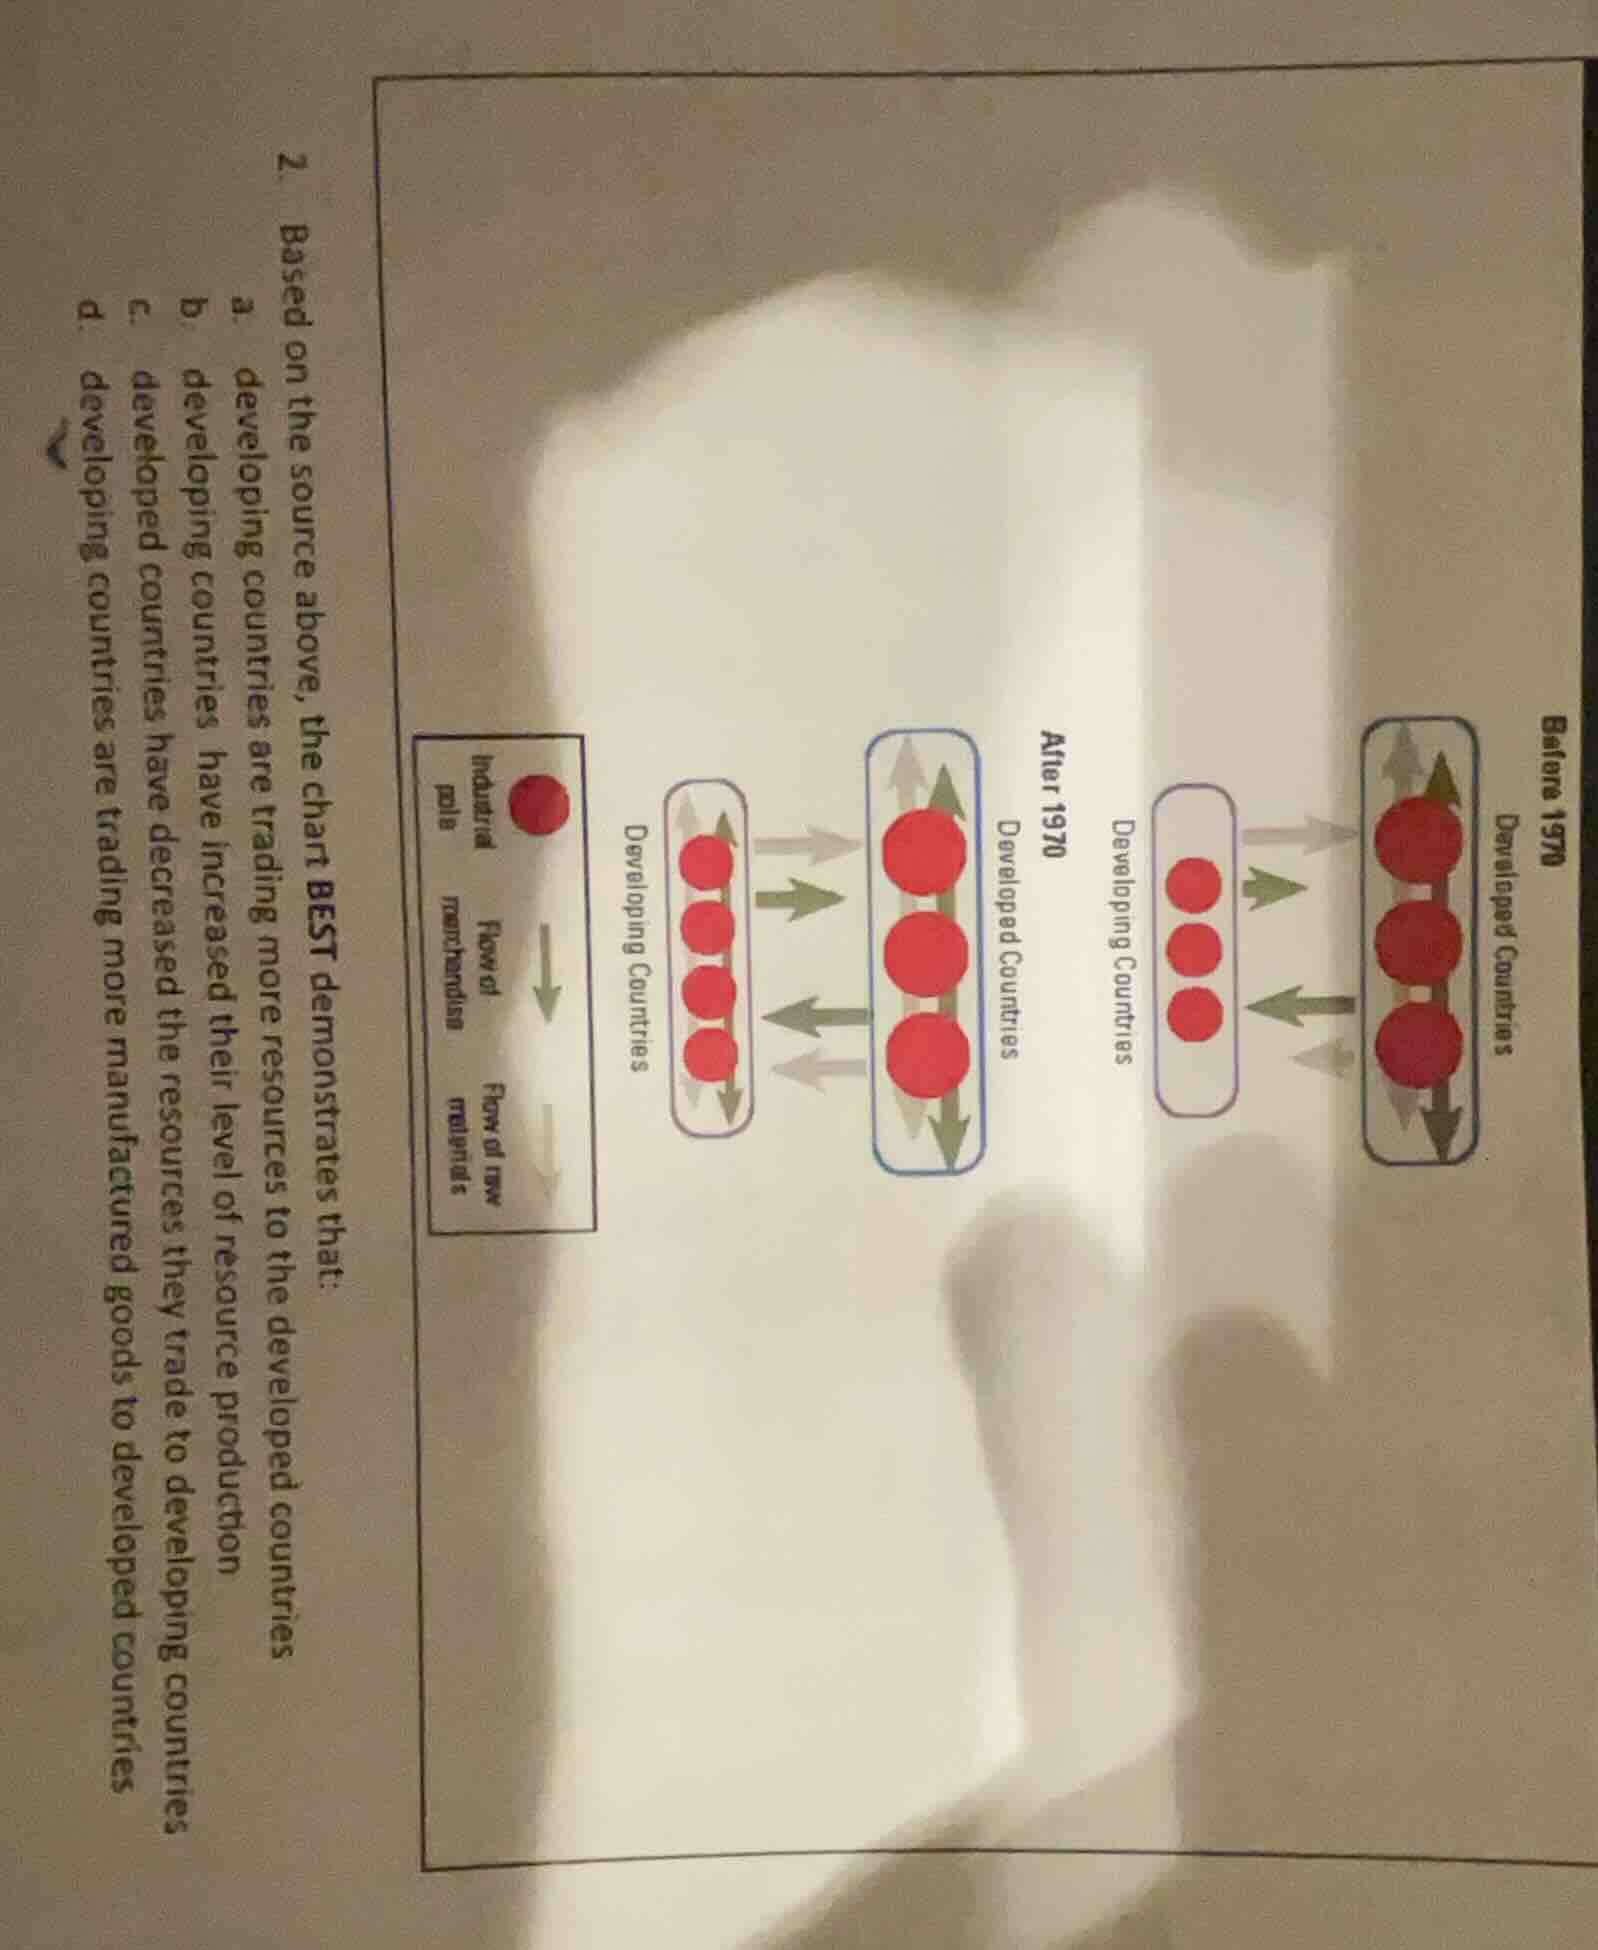
- based on the source above, the chart best demonstrates that:
a. developing countries are trading more resources to the developed countries
b. developing countries have increased their level of resource production
c. developed countries have decreased the resources they trade to developing countries
d. developing countries are trading more manufactured goods to developed countries
Brief Explanations
- Analyze the "Before 1970" chart: Developing countries have a small number of industrial poles, and the main flow is raw materials going to developed countries, with manufactured goods flowing back.
- Analyze the "After 1970" chart: Developing countries have more industrial poles, and there is a significant two-way flow of manufactured goods, meaning developing countries are exporting more manufactured goods to developed countries.
- Evaluate options:
- a: The chart shows a reduced focus on raw material flow from developing to developed countries, not an increase.
- b: The chart does not measure resource production levels, only trade flows.
- c: The chart shows developed countries still trade resources, not a decrease.
- d: The growth in industrial poles and two-way manufactured goods flow confirms developing countries trade more manufactured goods to developed countries.

Snap & solve any problem in the app
Get step-by-step solutions on Sovi AI
Photo-based solutions with guided steps
Explore more problems and detailed explanations
d. developing countries are trading more manufactured goods to developed countries