QUESTION IMAGE
Question
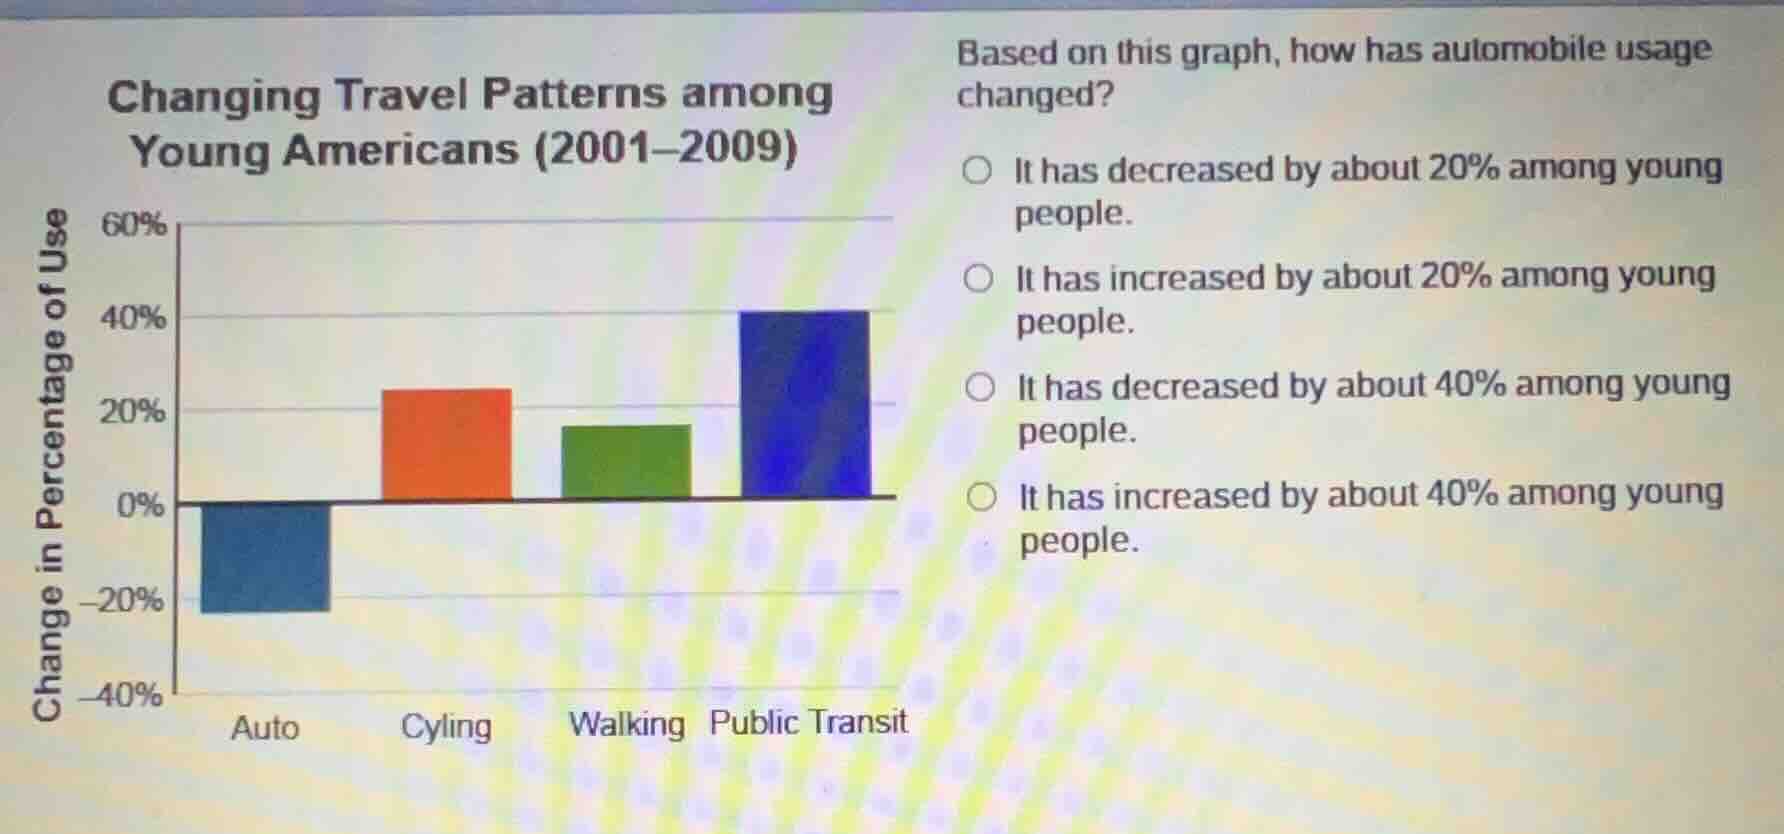
changing travel patterns among young americans (2001–2009)
based on this graph, how has automobile usage changed?
○ it has decreased by about 20% among young people.
○ it has increased by about 20% among young people.
○ it has decreased by about 40% among young people.
○ it has increased by about 40% among young people.
The bar graph shows the change in percentage of use for different travel modes among young Americans between 2001-2009. The "Auto" category has a negative change of approximately 20%, meaning automobile usage decreased by this amount.

Snap & solve any problem in the app
Get step-by-step solutions on Sovi AI
Photo-based solutions with guided steps
Explore more problems and detailed explanations
It has decreased by about 20% among young people.