QUESTION IMAGE
Question
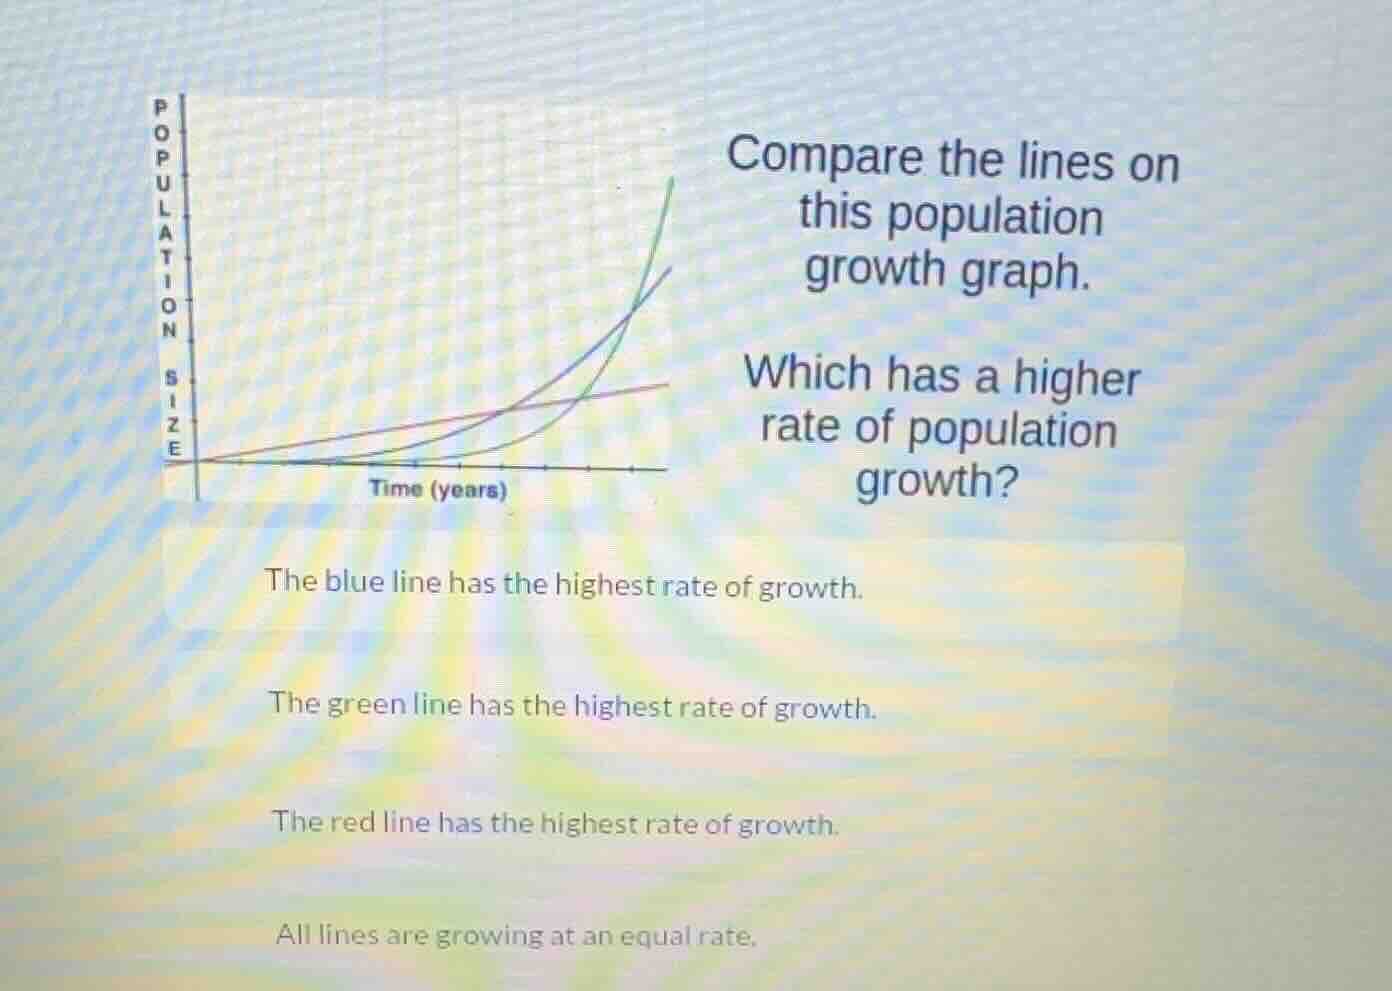
compare the lines on this population growth graph. which has a higher rate of population growth? the blue line has the highest rate of growth. the green line has the highest rate of growth. the red line has the highest rate of growth. all lines are growing at an equal rate.
To determine the rate of population growth from a graph, we look at the slope (or the steepness) of the lines over time. A steeper line indicates a higher growth rate. The green line appears to be the steepest among the lines shown, meaning it has the highest rate of population growth.

Snap & solve any problem in the app
Get step-by-step solutions on Sovi AI
Photo-based solutions with guided steps
Explore more problems and detailed explanations
The green line has the highest rate of growth.