QUESTION IMAGE
Question
consider the following.
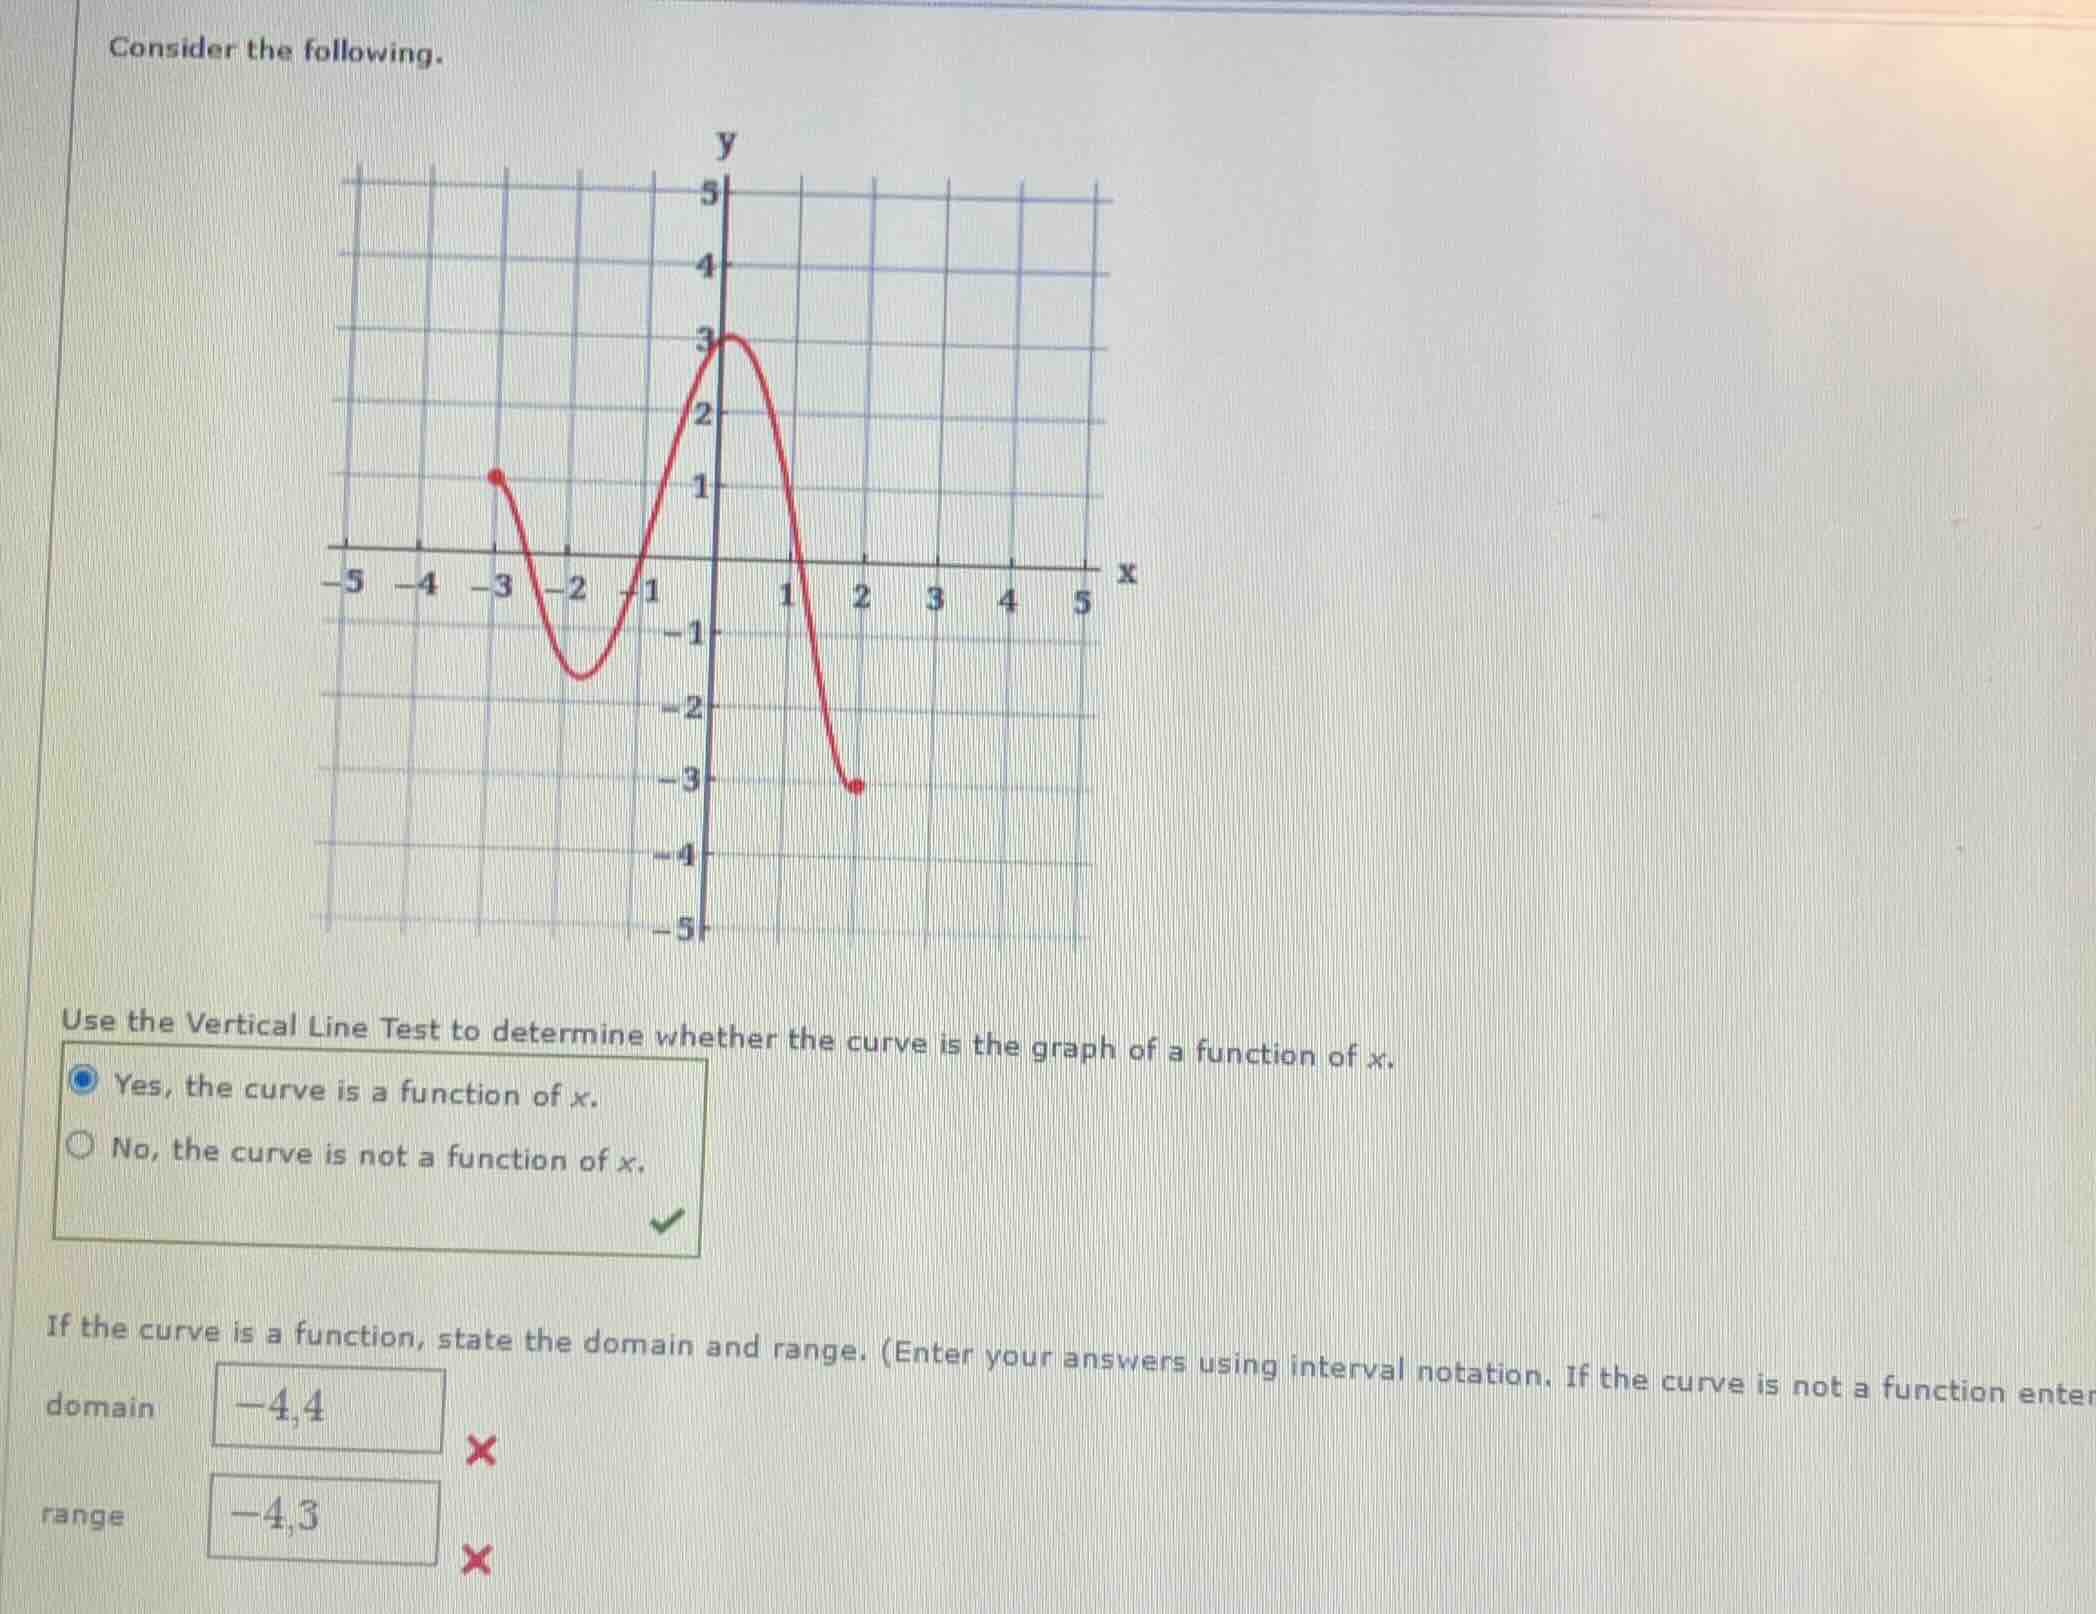
graph of a curve on a coordinate plane
use the vertical line test to determine whether the curve is the graph of a function of x.
- yes, the curve is a function of x.
- no, the curve is not a function of x.
if the curve is a function, state the domain and range. (enter your answers using interval notation. if the curve is not a function enter...)
- domain: -4,4 (marked incorrect)
- range: -4,3 (marked incorrect)
Step1: Determine the domain
The domain is the set of all x - values for which the function is defined. Looking at the graph, the leftmost point has an x - value of - 3 (since there is a closed dot at x=-3) and the rightmost point has an x - value of 2 (since there is a closed dot at x = 2). So, the domain is the interval from - 3 to 2, inclusive. In interval notation, this is $[-3,2]$.
Step2: Determine the range
The range is the set of all y - values that the function takes. The lowest y - value on the graph is - 3 (from the closed dot at (2, - 3)) and the highest y - value is 3 (from the peak of the graph). So, the range is the interval from - 3 to 3, inclusive. In interval notation, this is $[-3,3]$.

Snap & solve any problem in the app
Get step-by-step solutions on Sovi AI
Photo-based solutions with guided steps
Explore more problems and detailed explanations
Domain: $[-3, 2]$
Range: $[-3, 3]$