QUESTION IMAGE
Question
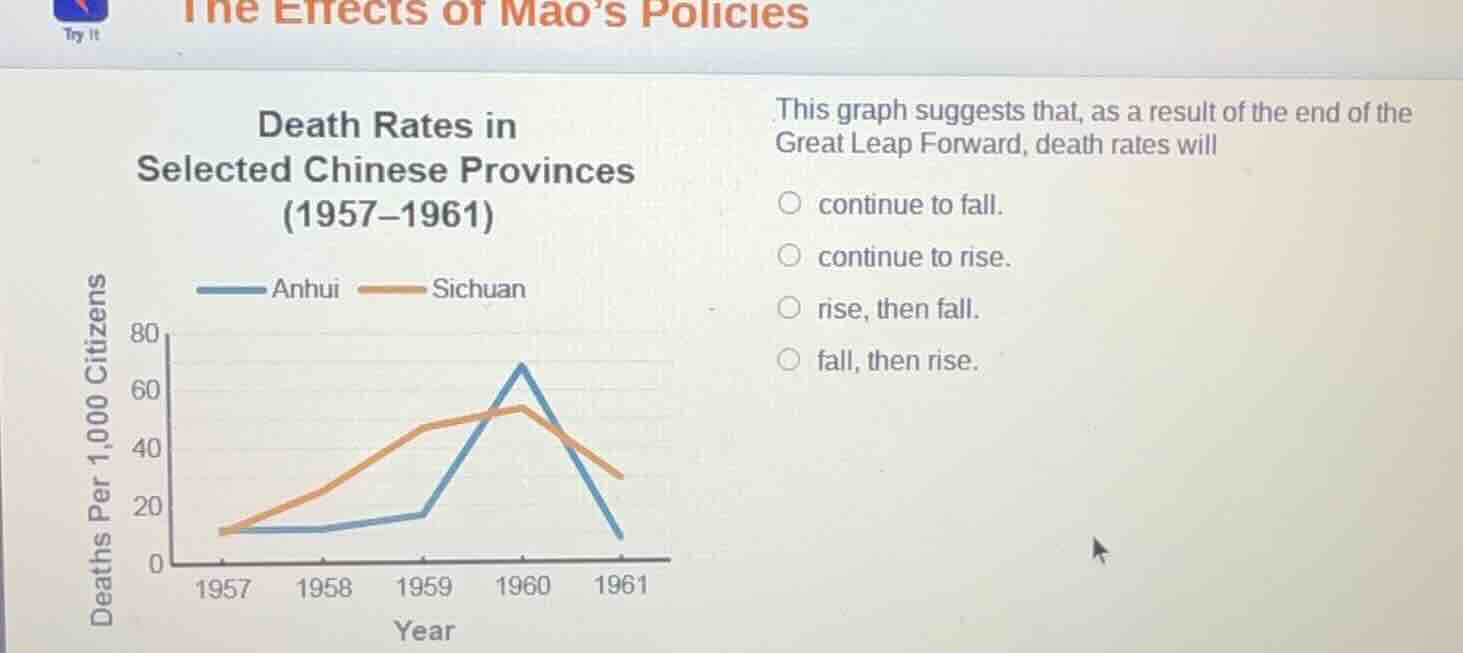
death rates in selected chinese provinces (1957–1961) this graph suggests that, as a result of the end of the great leap forward, death rates will continue to fall. continue to rise. rise, then fall. fall, then rise.
Brief Explanations
The line graph shows death rates for Anhui and Sichuan from 1957-1961. After peaking in 1960 (during the Great Leap Forward), both provinces' death rates fall sharply in 1961, indicating a downward trend following the end of the policy.

Snap & solve any problem in the app
Get step-by-step solutions on Sovi AI
Photo-based solutions with guided steps
Explore more problems and detailed explanations
continue to fall.