QUESTION IMAGE
Question
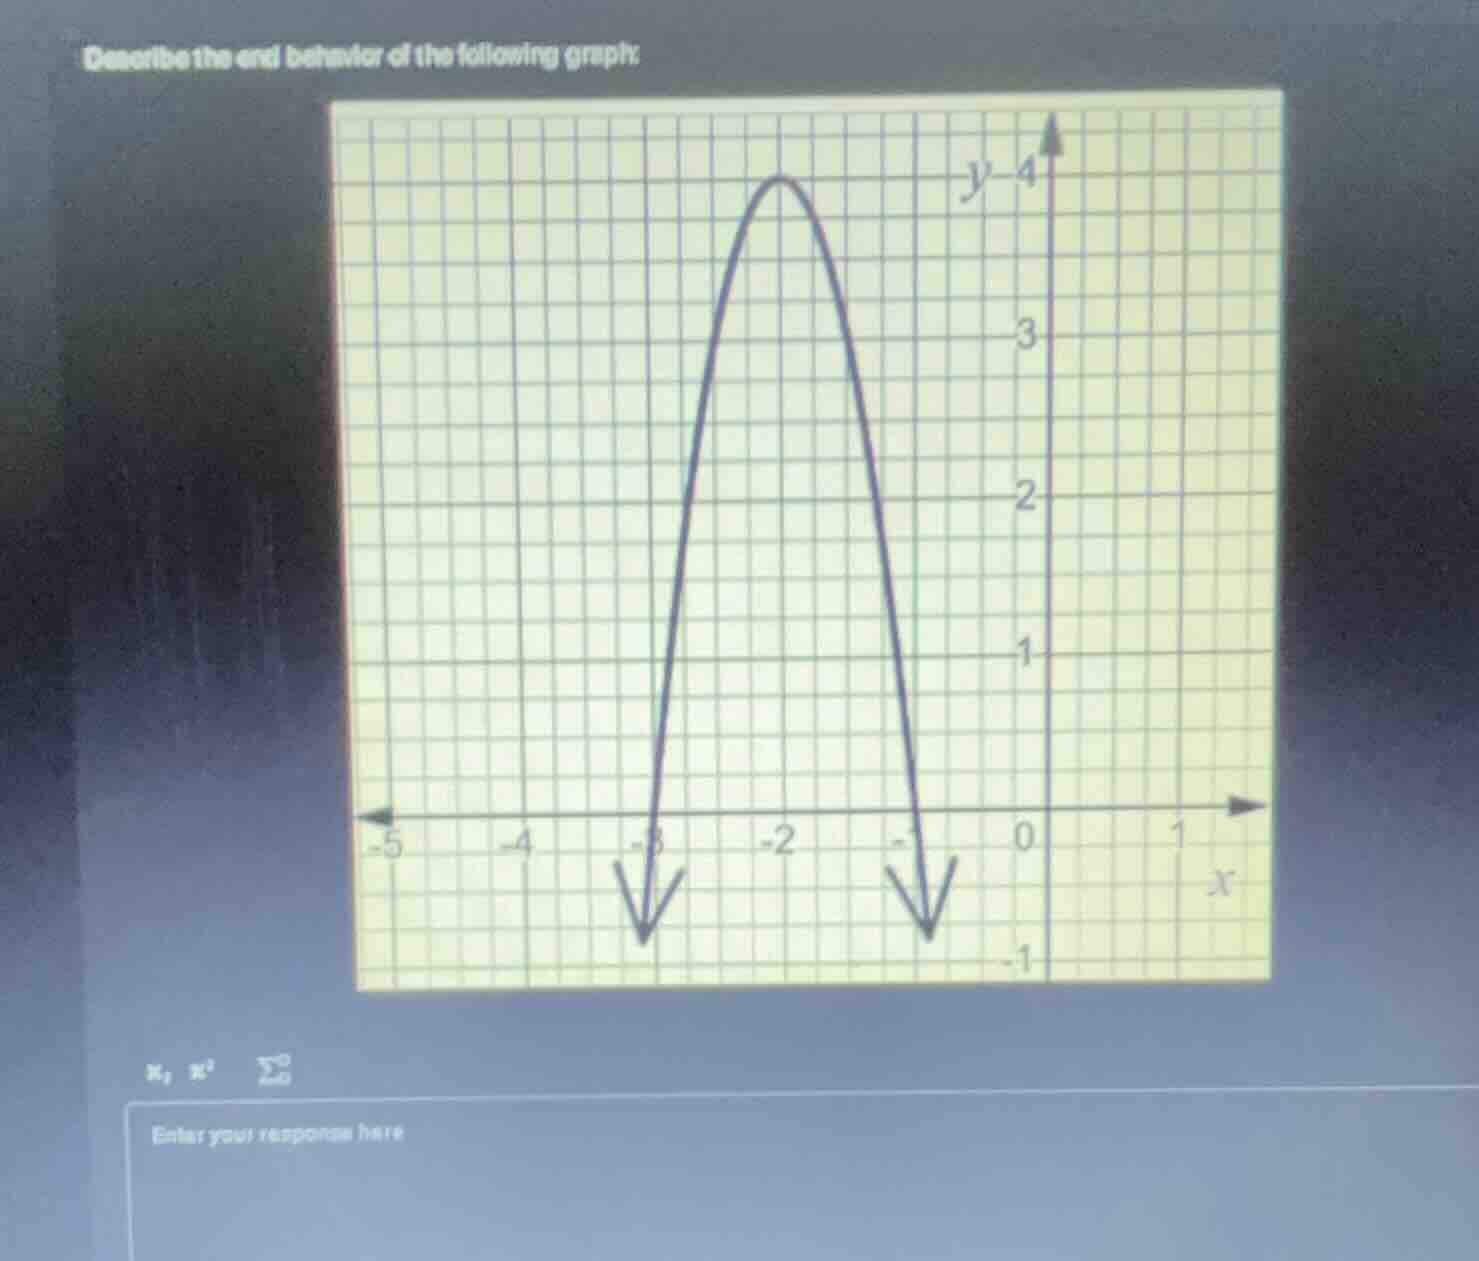
describe the end behavior of the following graph: enter your response here
Brief Explanations
End behavior describes the direction of the graph as $x$ approaches positive and negative infinity. For this downward-opening parabola, as $x$ moves toward $+\infty$ or $-\infty$, the $y$-values decrease toward $-\infty$.

Snap & solve any problem in the app
Get step-by-step solutions on Sovi AI
Photo-based solutions with guided steps
Explore more problems and detailed explanations
As $x \to +\infty$, $y \to -\infty$; as $x \to -\infty$, $y \to -\infty$