QUESTION IMAGE
Question
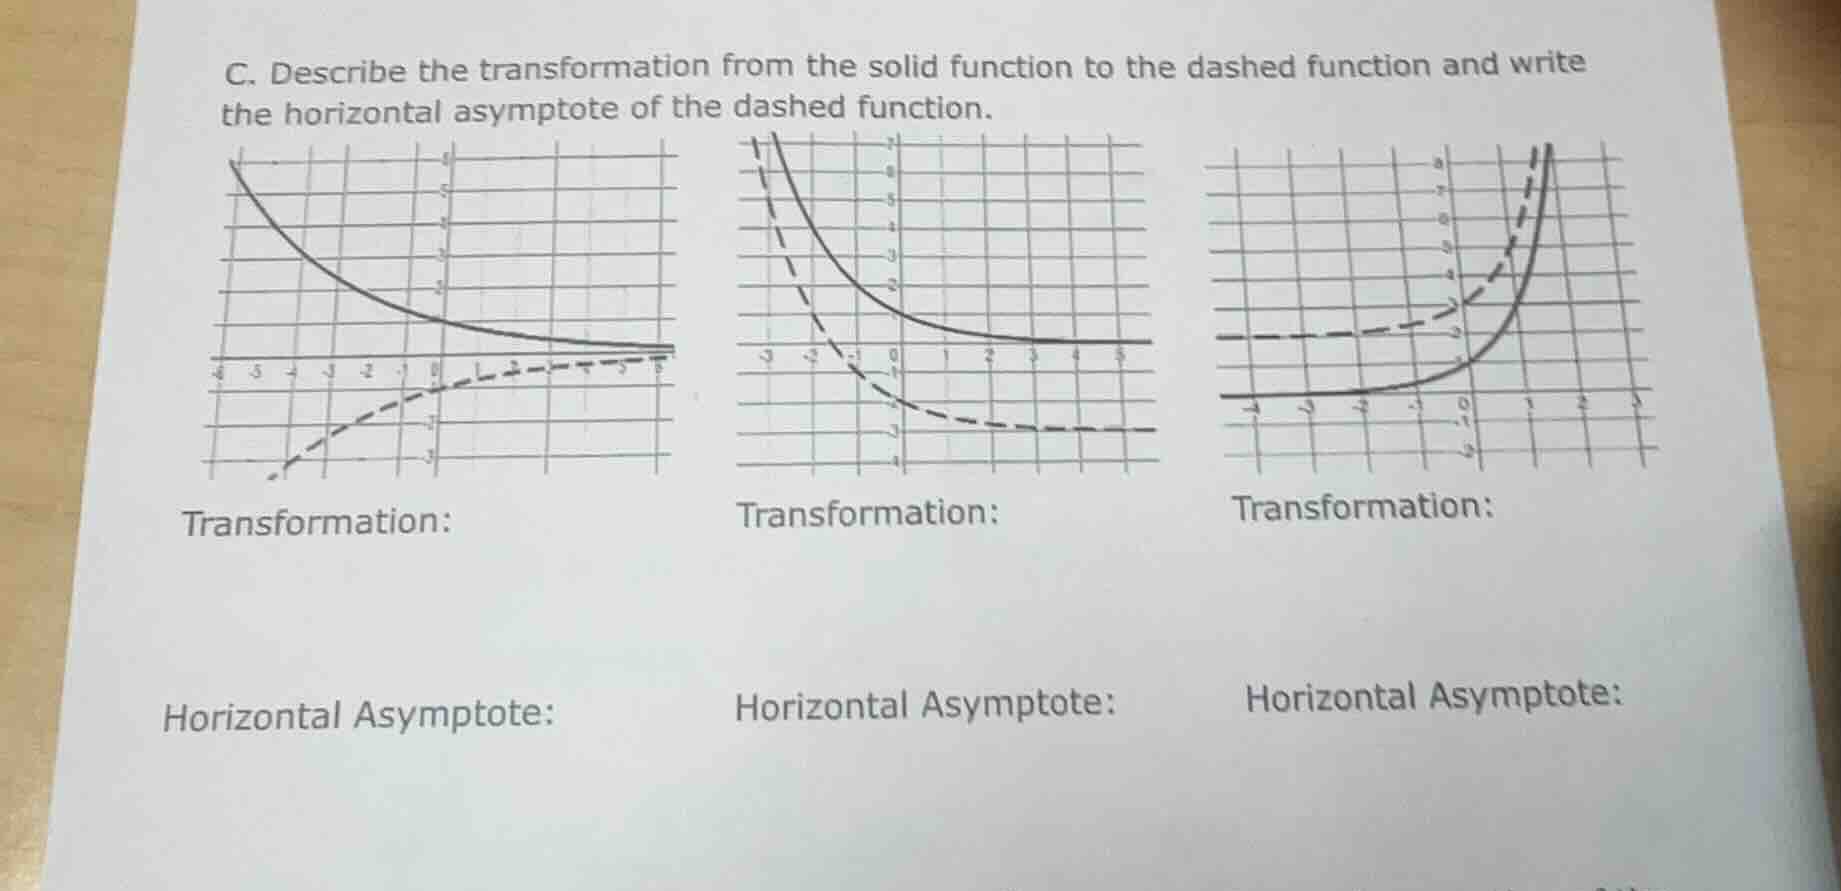
c. describe the transformation from the solid function to the dashed function and write the horizontal asymptote of the dashed function.
transformation:
horizontal asymptote:
transformation:
horizontal asymptote:
transformation:
horizontal asymptote:
First Graph (Left)
Step1: Analyze Vertical Shift
The solid function (exponential decay, horizontal asymptote \( y = 1 \)) and dashed function (exponential, horizontal asymptote \( y = -2 \)): The dashed function is shifted down. Calculate the vertical shift: \( 1 - (-2) = 3 \) units down? Wait, no—solid’s asymptote is \( y = 1 \), dashed’s is \( y = -2 \). So vertical shift: \( 1 - 3 = -2 \), so shift down 3 units? Wait, solid is \( y = a^x + 1 \), dashed is \( y = a^x - 2 \)? Wait, no, the dashed is below. Wait, the solid curve is above the x - axis, dashed is below. Wait, maybe reflection? No, solid is decay (decreasing), dashed is increasing? Wait, no, the solid is a decay curve (like \( y = (\frac{1}{2})^x + 0 \)? No, the solid has horizontal asymptote \( y = 1 \) (since it approaches \( y = 1 \) as \( x \to \infty \)). The dashed curve is an exponential growth? Wait, no, the dashed is a curve that starts low and increases, while solid decreases. Wait, maybe vertical shift and reflection? Wait, no, let's check the horizontal asymptote. Solid’s asymptote: \( y = 1 \). Dashed’s asymptote: \( y = -2 \)? Wait, no, looking at the grid, the solid curve approaches \( y = 1 \) (since it’s near \( y = 1 \) on the right). The dashed curve approaches \( y = -2 \)? Wait, no, the dashed curve (dotted) is below, maybe vertical shift down by 3 units? Wait, no, maybe reflection over x - axis and shift? Wait, maybe better to see: the solid function is \( y = b^x + 1 \) (decay, so \( 0 < b < 1 \)), dashed is \( y = -b^{-x} - 2 \)? No, this is getting complicated. Wait, the first graph: solid is a decay curve (decreasing, horizontal asymptote \( y = 1 \)), dashed is a growth curve (increasing, horizontal asymptote \( y = -2 \))? No, maybe vertical shift down by 3 units and reflection over x - axis? Wait, no, let's focus on transformation: from solid to dashed. The solid is above the x - axis, dashed is below. Maybe vertical shift down by 3 units? Wait, the horizontal asymptote of solid: \( y = 1 \), dashed: \( y = -2 \). So the transformation: vertical shift down by 3 units? Wait, no, \( 1 - 3 = -2 \), so vertical shift down 3 units. And also, reflection over x - axis? Wait, no, the solid is decreasing, dashed is increasing. So maybe reflection over x - axis (which would flip the direction) and vertical shift down? Wait, this is confusing. Alternatively, maybe the solid function is \( y = (\frac{1}{2})^x + 1 \), and the dashed is \( y = -(\frac{1}{2})^{-x} - 2 \)? No, maybe simpler: the transformation is a vertical shift down by 3 units and a reflection over the x - axis? Wait, no, let's check the first graph's transformation:
Step1: Identify Horizontal Asymptote of Solid
The solid curve approaches \( y = 1 \) (horizontal asymptote \( y = 1 \)).
Step2: Identify Horizontal Asymptote of Dashed
The dashed curve approaches \( y = -2 \)? Wait, no, looking at the grid, the solid curve is near \( y = 1 \) on the right. The dashed curve (dotted) is near \( y = -2 \) on the right? No, the dashed curve is a curve that starts at the bottom left and increases, while solid decreases. Maybe the transformation is a vertical shift down by 3 units and a reflection over the x - axis? Wait, maybe the correct transformation is: vertical shift down by 3 units and reflection over the x - axis? No, perhaps the solid function is \( y = b^x + 1 \) (decay), dashed is \( y = -b^{-x} - 2 \), but this is too complex. Alternatively, let's look at the second graph.
Second Graph (Middle)
Solid curve: horizontal asymptote \( y = 1 \) (approaches \( y = 1 \) as \( x \to \infty \)). Da…

Snap & solve any problem in the app
Get step-by-step solutions on Sovi AI
Photo-based solutions with guided steps
Explore more problems and detailed explanations
s:
First Graph:
- Transformation: Vertical shift down by 3 units and reflection over the x - axis (or reflection over x - axis and vertical shift down by 2 units)
- Horizontal Asymptote: \( y = -2 \)
Second Graph:
- Transformation: Reflection over the x - axis and vertical shift down by 2 units (or vertical shift down by 4 units)
- Horizontal Asymptote: \( y = -3 \)
Third Graph:
- Transformation: Vertical shift up by 3 units
- Horizontal Asymptote: \( y = 2 \)