QUESTION IMAGE
Question
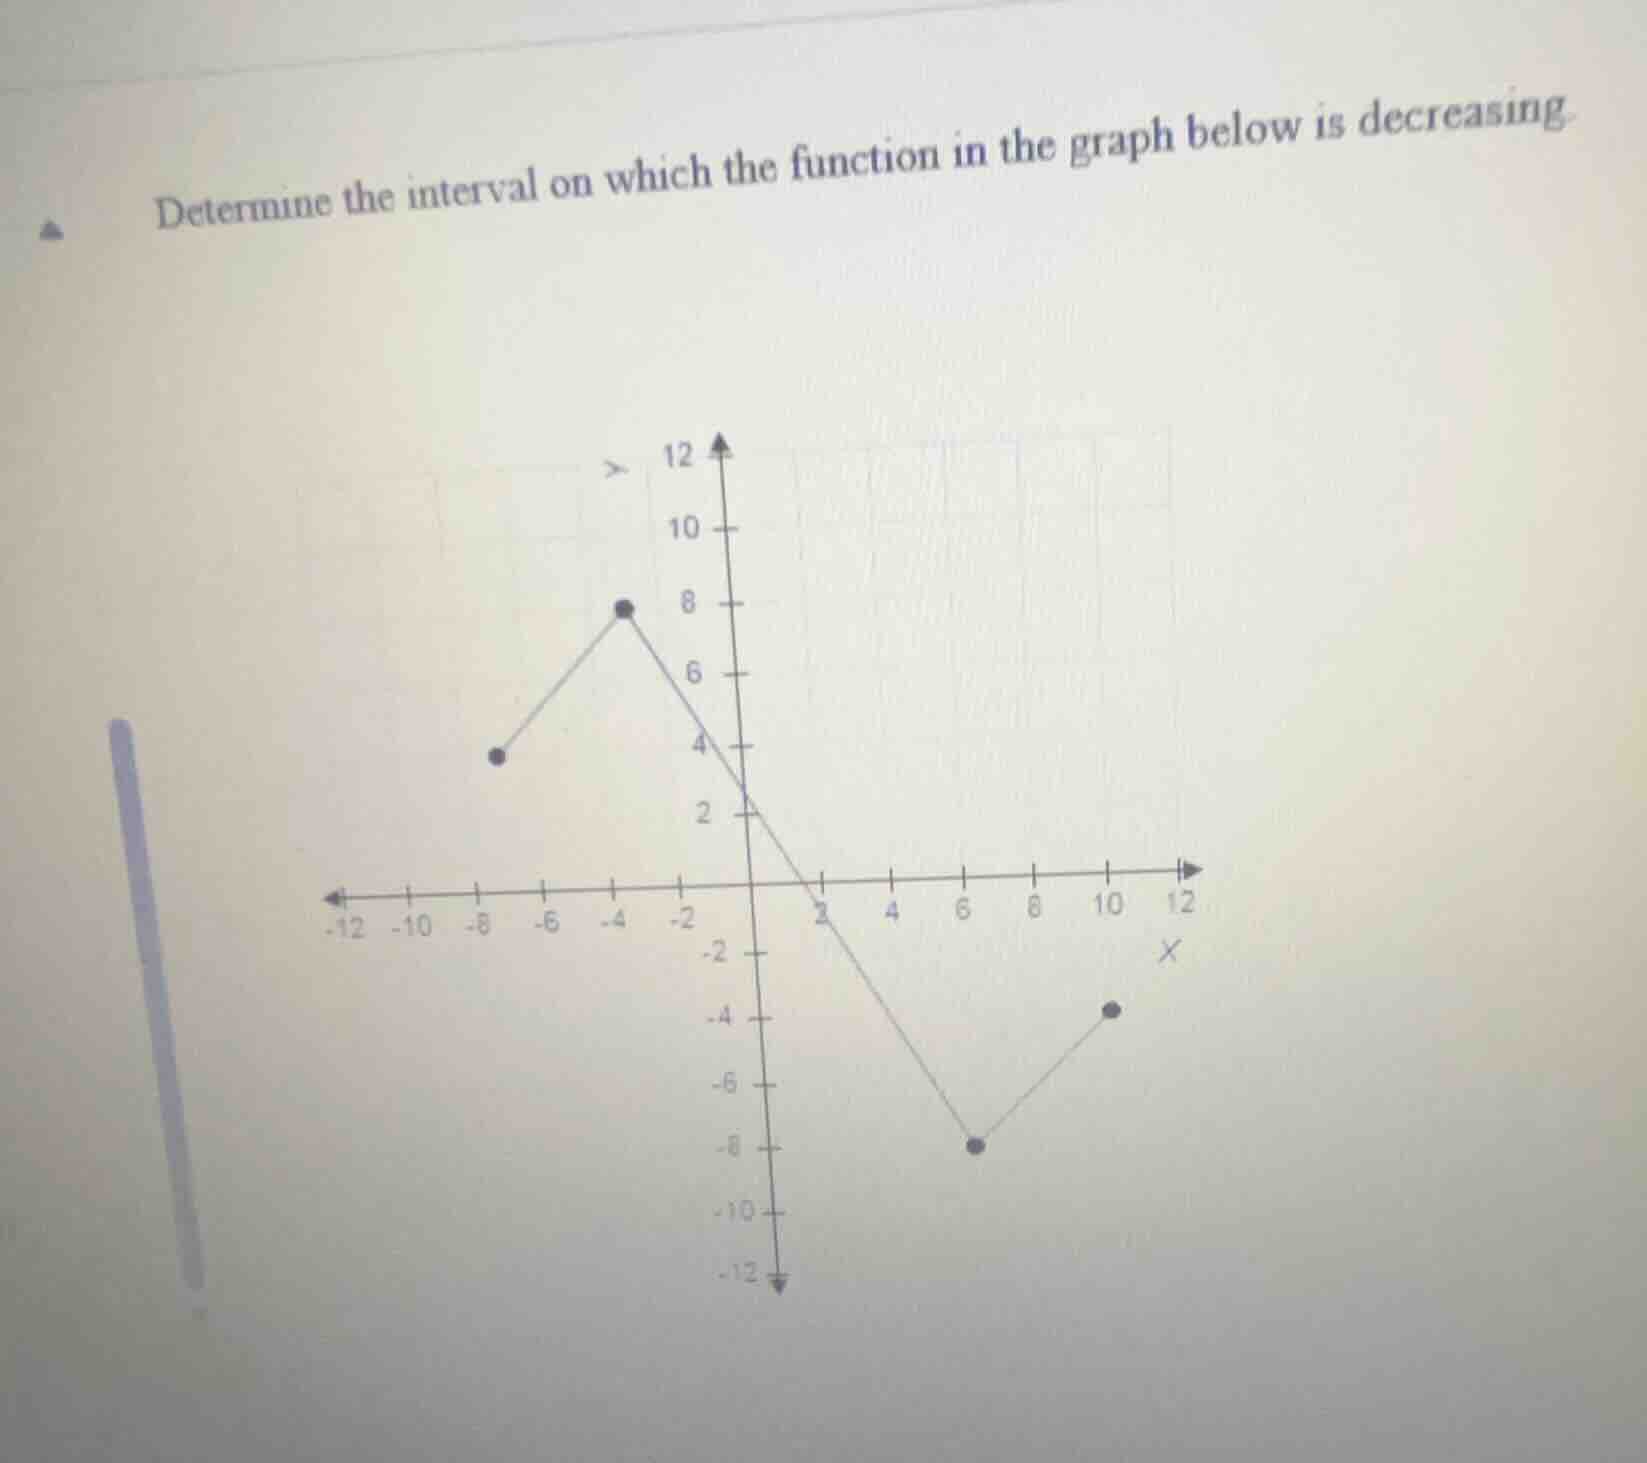
determine the interval on which the function in the graph below is decreasing.
Step1: Understand decreasing function
A function is decreasing on an interval if, as \( x \) increases, \( y \) decreases. So we look at the graph's slope: negative slope means decreasing.
Step2: Identify the interval
From the graph, the peak is at \( x = -4 \), then it decreases until the valley at \( x = 6 \)? Wait, no, let's check the points. Wait, the first segment: from \( x = -6 \) (or left point) to \( x = -4 \), it's increasing. Then from \( x = -4 \) to \( x = 6 \), the graph is decreasing (since as \( x \) goes from -4 to 6, \( y \) goes from 8 down to -8). Then from \( x = 6 \) to \( x = 10 \) (or right point), it's increasing. Wait, let's confirm the x-values. The peak is at \( x = -4 \), then the line goes down through \( x = 0 \), \( x = 2 \), until \( x = 6 \) (the valley). So the interval where \( x \) increases and \( y \) decreases is from \( x = -4 \) to \( x = 6 \). Wait, let's check the coordinates. The peak is at \( (-4, 8) \), then the next key point is \( (6, -8) \)? Wait, no, the valley is at \( (6, -8) \)? Wait, the graph: from \( x = -4 \) (peak) to \( x = 6 \) (valley), the function is decreasing because as \( x \) moves from -4 to 6 (increasing), \( y \) moves from 8 to -8 (decreasing). Then after \( x = 6 \), it increases again. So the interval where the function is decreasing is \( (-4, 6) \)? Wait, but we need to check the endpoints. Wait, the left end of the decreasing segment is at \( x = -4 \) (closed dot) and the right end is at \( x = 6 \) (closed dot)? Wait, the valley is at \( (6, -8) \), which is a closed dot? So the interval is from \( x = -4 \) to \( x = 6 \), inclusive? Wait, no, let's see the graph again. The first part: from \( x = -6 \) (or left point) to \( x = -4 \): increasing (slope positive). Then from \( x = -4 \) to \( x = 6 \): slope negative (decreasing). Then from \( x = 6 \) to \( x = 10 \): slope positive (increasing). So the decreasing interval is \( [-4, 6] \)? Wait, but let's check the x-values. The peak is at \( x = -4 \), then the function decreases until \( x = 6 \) (the valley). So the interval where the function is decreasing is \( x \in [-4, 6] \). Wait, but maybe the problem uses open or closed intervals. Wait, the graph: the peak is at \( (-4, 8) \) (closed dot), then the line goes down to \( (6, -8) \) (closed dot), then up. So the interval where \( y \) decreases as \( x \) increases is from \( x = -4 \) to \( x = 6 \). So the interval is \( [-4, 6] \)? Wait, no, let's confirm with the definition: a function is decreasing on an interval \( I \) if for any \( x_1, x_2 \in I \) with \( x_1 < x_2 \), \( f(x_1) > f(x_2) \). So on \( [-4, 6] \), if we take \( x_1 = -4 \), \( x_2 = 6 \), \( f(-4) = 8 \), \( f(6) = -8 \), and for any \( x \) between -4 and 6, as \( x \) increases, \( f(x) \) decreases. So the interval is \( [-4, 6] \). Wait, but maybe the graph's x-axis: the peak is at \( x = -4 \), then the next point is \( x = 6 \) (valley). So the interval where the function is decreasing is from \( x = -4 \) to \( x = 6 \).

Snap & solve any problem in the app
Get step-by-step solutions on Sovi AI
Photo-based solutions with guided steps
Explore more problems and detailed explanations
The function is decreasing on the interval \(\boxed{[-4, 6]}\)