QUESTION IMAGE
Question
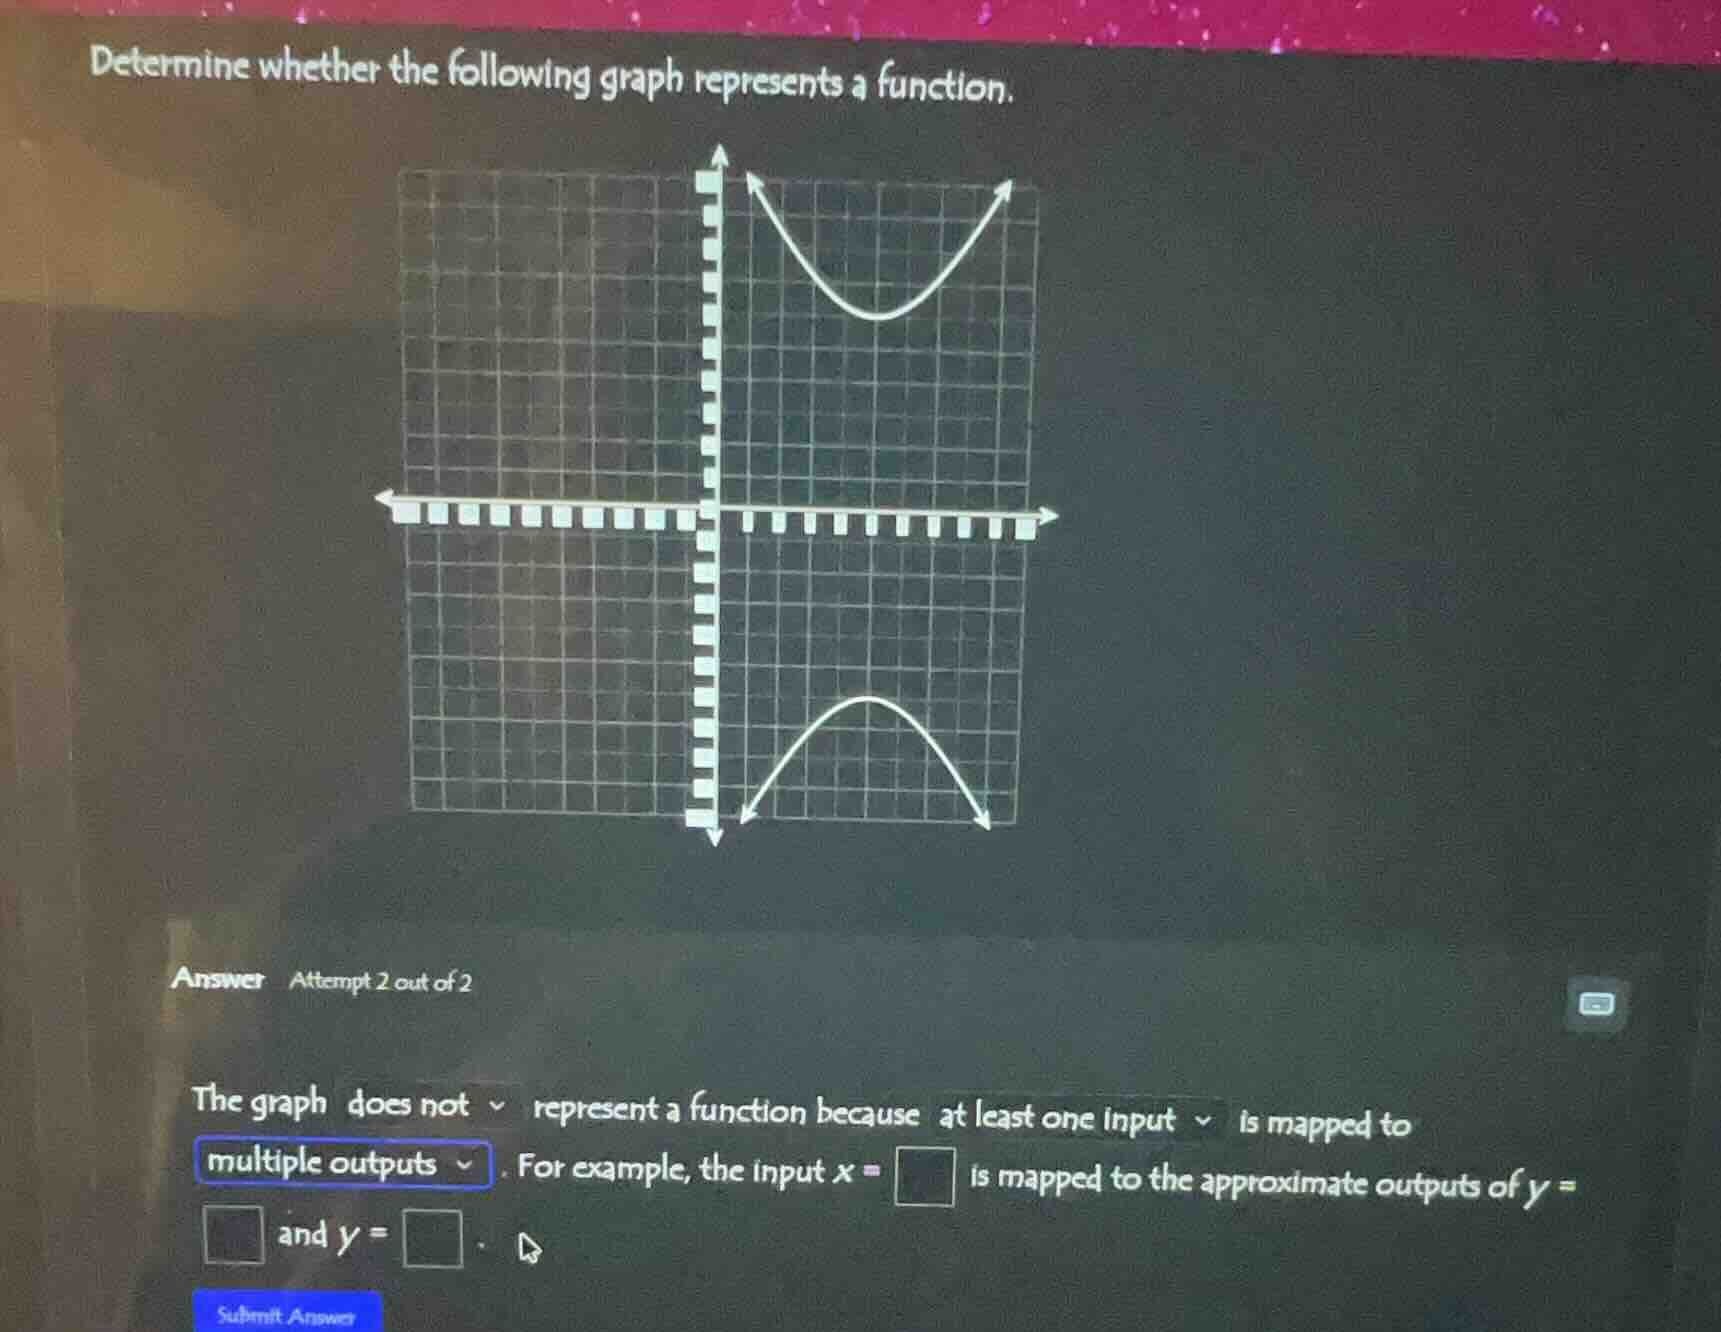
determine whether the following graph represents a function.
the graph does not represent a function because at least one input is mapped to multiple outputs. for example, the input x = \square is mapped to the approximate outputs of y = \square and y = \square.
Step1: Apply Vertical Line Test
Draw a vertical line at any $x$-value; if it intersects the graph more than once, the graph is not a function.
Step2: Pick a sample $x$-value
Choose $x=2$ (any positive/negative $x$ works, e.g., $x=2$).
Step3: Find corresponding $y$-values
For $x=2$, the upper parabola gives $y\approx 4$, the lower parabola gives $y\approx -4$.

Snap & solve any problem in the app
Get step-by-step solutions on Sovi AI
Photo-based solutions with guided steps
Explore more problems and detailed explanations
The graph does not represent a function because at least one input is mapped to multiple outputs. For example, the input $x=2$ is mapped to the approximate outputs of $y=4$ and $y=-4$.