QUESTION IMAGE
Question
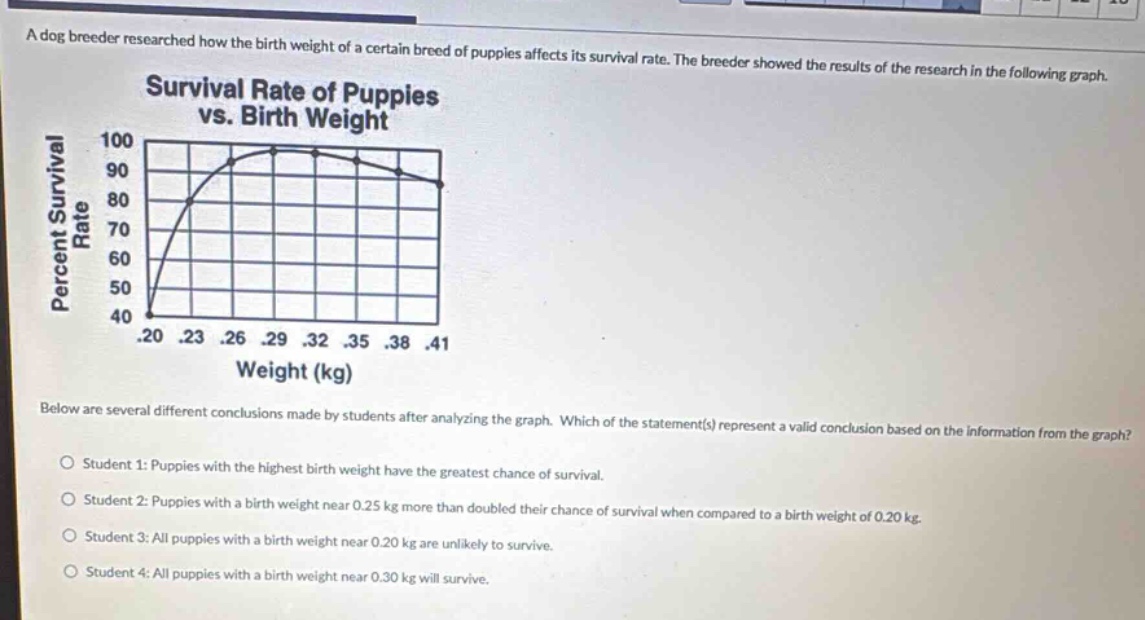
a dog breeder researched how the birth weight of a certain breed of puppies affects its survival rate. the breeder showed the results of the research in the following graph.
survival rate of puppies vs. birth weight
below are several different conclusions made by students after analyzing the graph. which of the statement(s) represent a valid conclusion based on the information from the graph?
student 1: puppies with the highest birth weight have the greatest chance of survival.
student 2: puppies with a birth weight near 0.25 kg more than doubled their chance of survival when compared to a birth weight of 0.20 kg.
student 3: all puppies with a birth weight near 0.20 kg are unlikely to survive.
student 4: all puppies with a birth weight near 0.30 kg will survive.
- Student 1: The graph shows survival rate peaks at ~0.29-0.32 kg, then decreases as weight increases beyond that. So highest weight does not mean greatest survival.
- Student 2: At 0.20 kg, survival rate is 40%; at ~0.25 kg, it is ~90%. $\frac{90}{40}=2.25$, which is more than double, so this is valid.
- Student 3: At 0.20 kg, survival rate is 40%, meaning 40% do survive—they are not "unlikely to survive" (unlikely would mean <50% but the statement overstates as all being unlikely, which is incorrect).
- Student 4: The graph shows 100% survival at ~0.30 kg, but this is a percentage, not a guarantee that all puppies will survive (it is a rate, not an absolute rule).

Snap & solve any problem in the app
Get step-by-step solutions on Sovi AI
Photo-based solutions with guided steps
Explore more problems and detailed explanations
Student 2: Puppies with a birth weight near 0.25 kg more than doubled their chance of survival when compared to a birth weight of 0.20 kg.