QUESTION IMAGE
Question
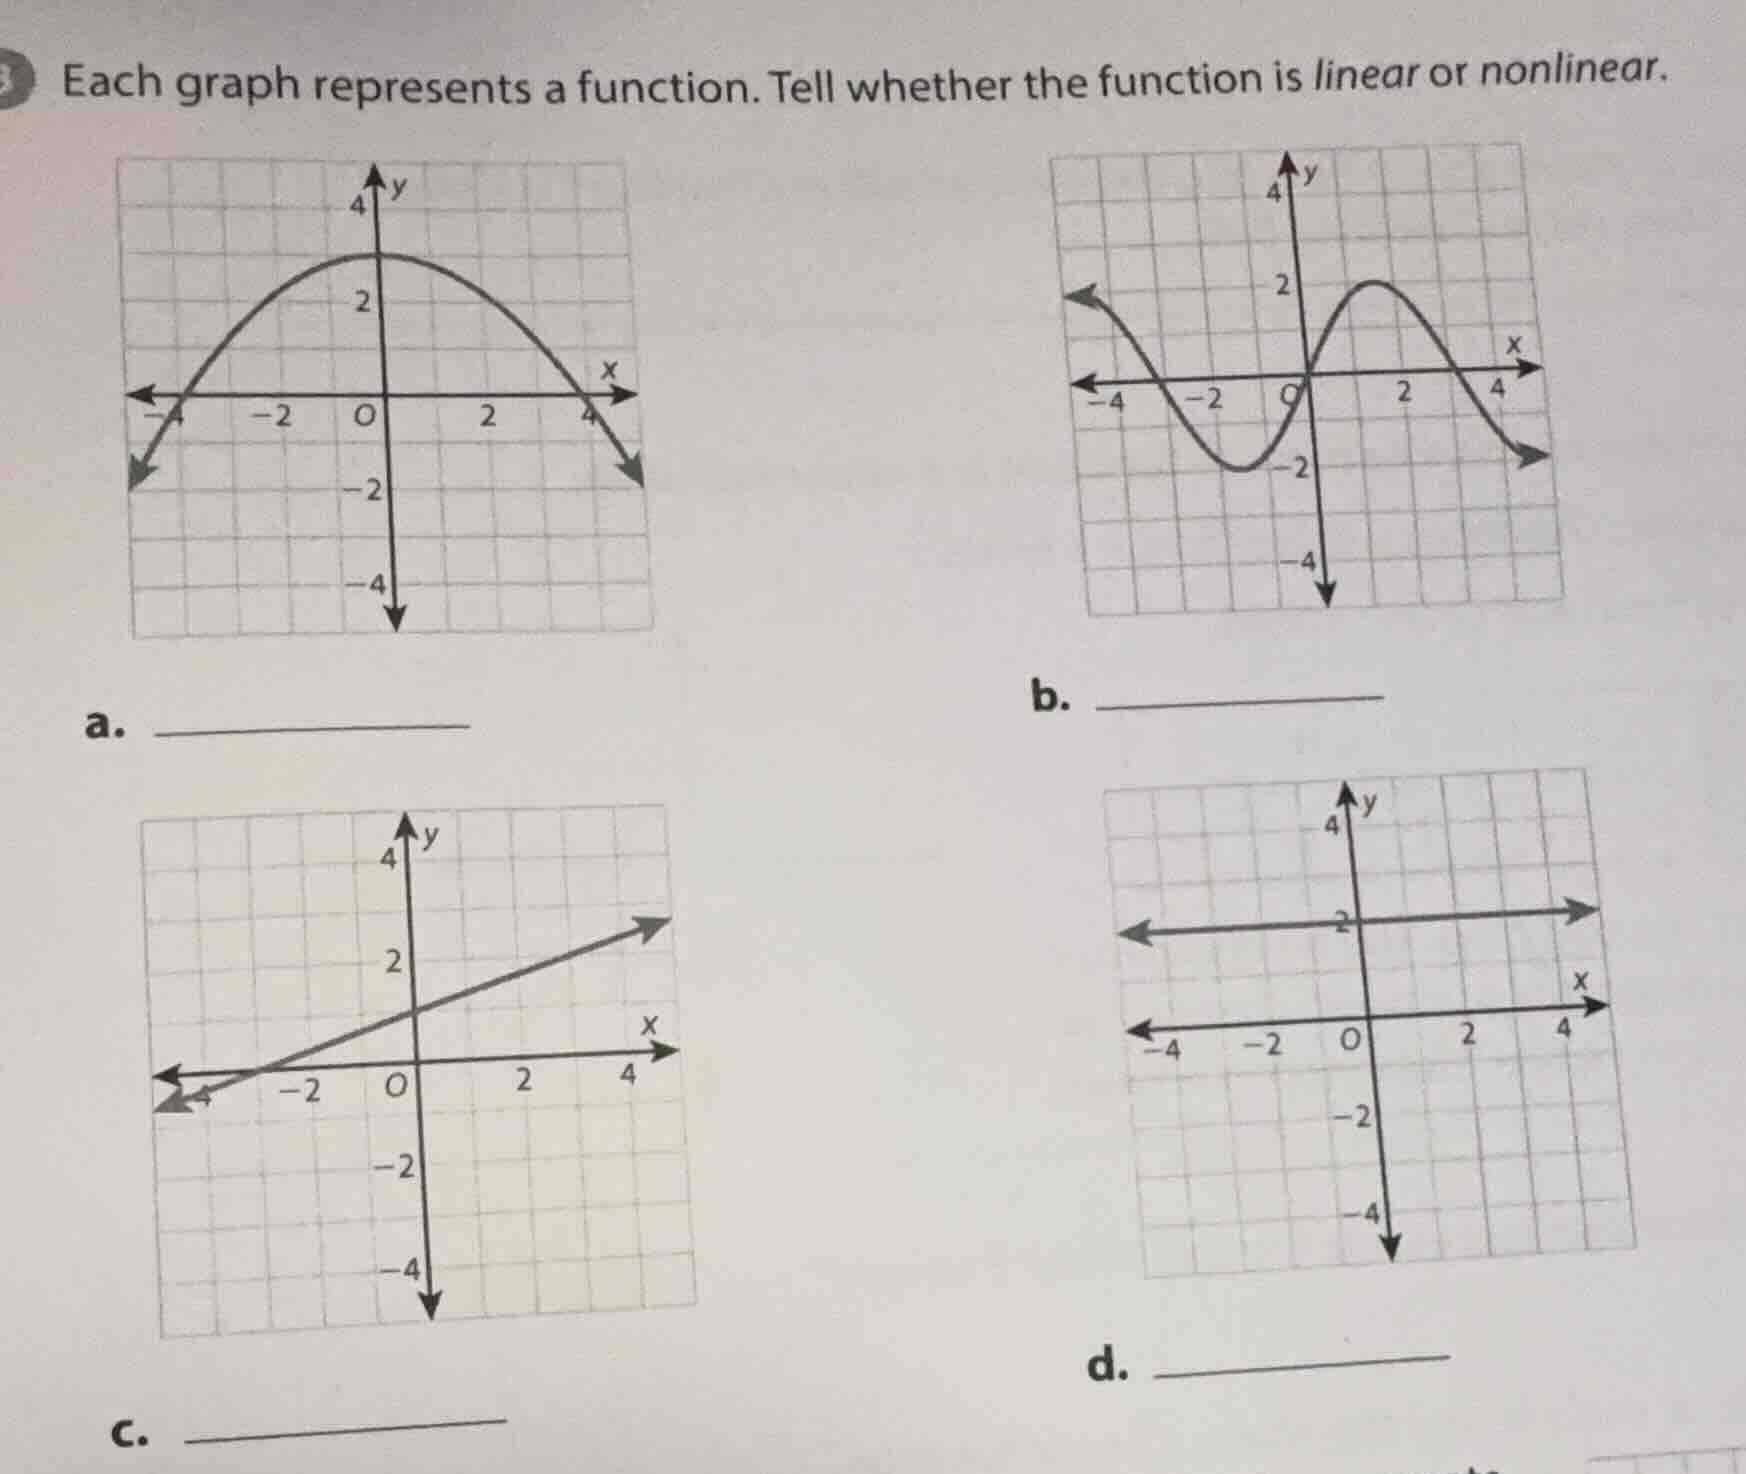
3 each graph represents a function. tell whether the function is linear or nonlinear.
a. _______
b. _______
c. _______
d. _______
Brief Explanations
A linear function graphs as a straight line, with a constant rate of change. A nonlinear function graphs as a curved line, with a non-constant rate of change.
- a. The graph is a curved parabola, so it is nonlinear.
- b. The graph has curves and multiple peaks/valleys, so it is nonlinear.
- c. The graph is a straight line, so it is linear.
- d. The graph is a horizontal straight line, so it is linear.

Snap & solve any problem in the app
Get step-by-step solutions on Sovi AI
Photo-based solutions with guided steps
Explore more problems and detailed explanations
a. Nonlinear
b. Nonlinear
c. Linear
d. Linear