QUESTION IMAGE
Question
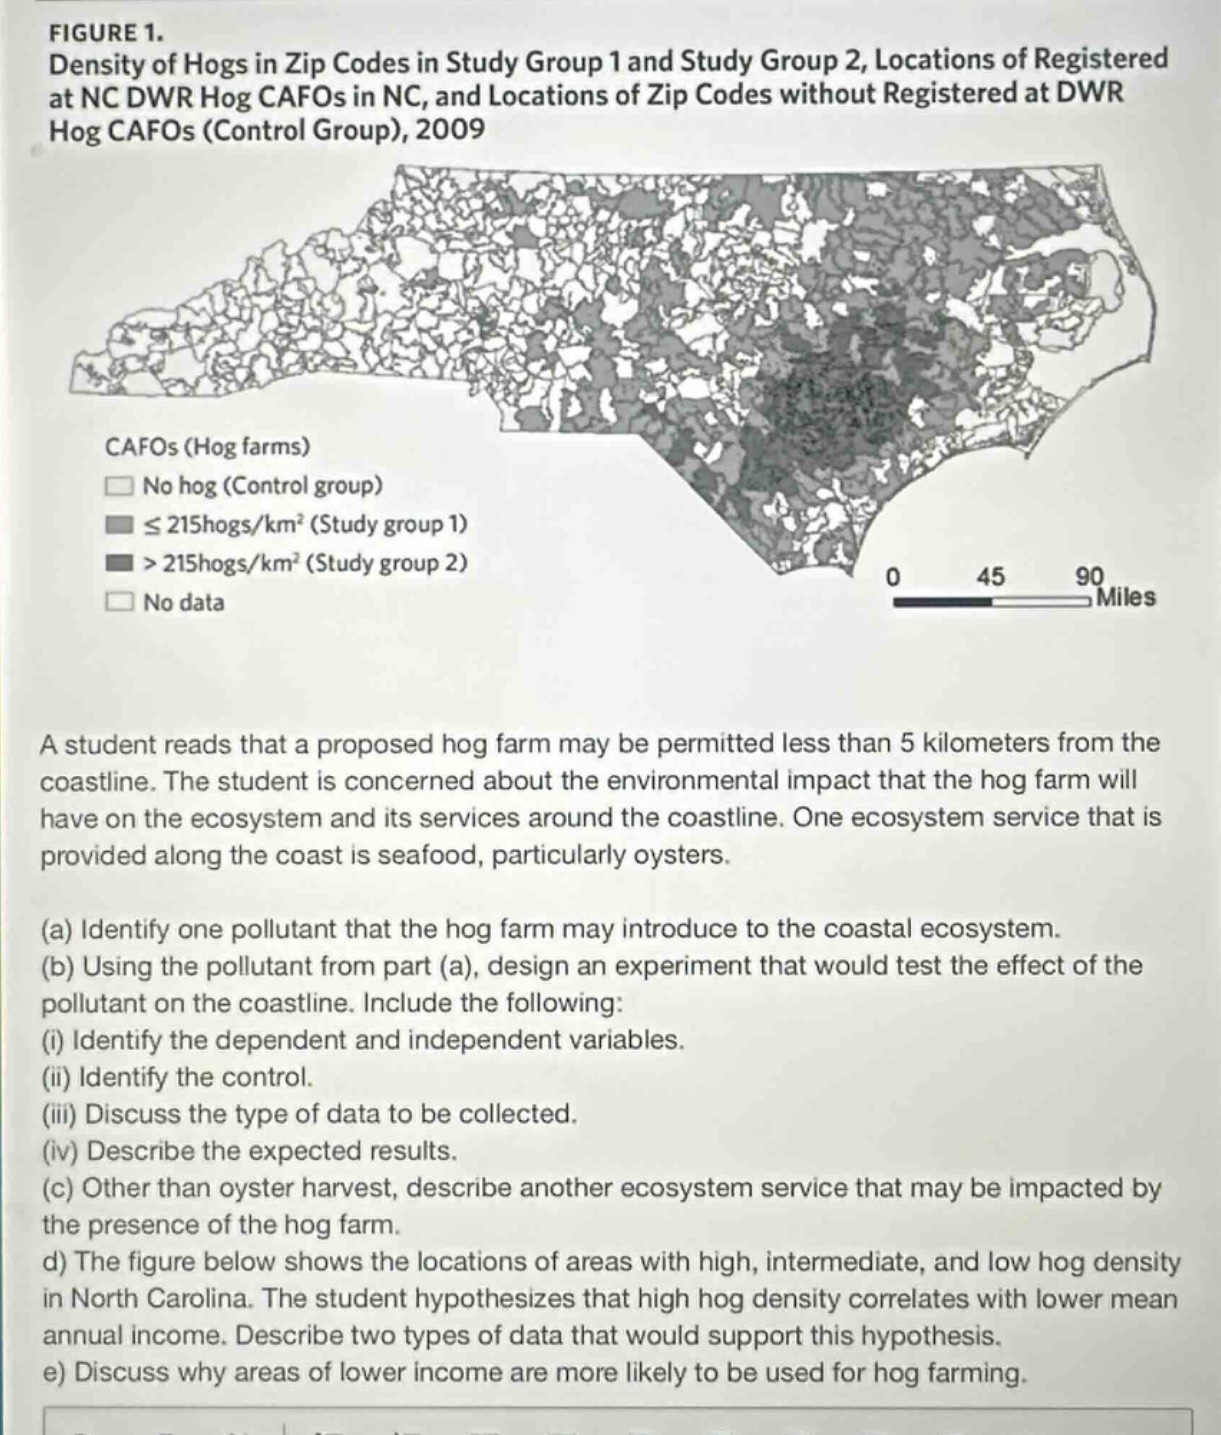
figure 1.
density of hogs in zip codes in study group 1 and study group 2, locations of registered at nc dwr hog cafos in nc, and locations of zip codes without registered at dwr hog cafos (control group), 2009
cafos (hog farms)
□ no hog (control group)
■ ≤215hogs/km² (study group 1)
■ >215hogs/km² (study group 2)
□ no data
0 45 90
miles
a student reads that a proposed hog farm may be permitted less than 5 kilometers from the coastline. the student is concerned about the environmental impact that the hog farm will have on the ecosystem and its services around the coastline. one ecosystem service that is provided along the coast is seafood, particularly oysters.
(a) identify one pollutant that the hog farm may introduce to the coastal ecosystem.
(b) using the pollutant from part (a), design an experiment that would test the effect of the pollutant on the coastline. include the following:
(i) identify the dependent and independent variables.
(ii) identify the control.
(iii) discuss the type of data to be collected.
(iv) describe the expected results.
(c) other than oyster harvest, describe another ecosystem service that may be impacted by the presence of the hog farm.
d) the figure below shows the locations of areas with high, intermediate, and low hog density in north carolina. the student hypothesizes that high hog density correlates with lower mean annual income. describe two types of data that would support this hypothesis.
e) discuss why areas of lower income are more likely to be used for hog farming.
Part (a)
Hog farms generate large volumes of waste containing nitrogen (in forms like ammonia or nitrate) from manure, which is a common pollutant that can runoff into coastal ecosystems.
Part (b)
(i) Independent variable: Concentration of nitrogen (the pollutant) in water; Dependent variable: Oyster survival rate/growth rate. The independent variable is the factor we manipulate, and the dependent variable is what we measure to see the effect.
(ii) Control: A group of oysters in natural, unpolluted coastal water (with no added nitrogen from hog waste) that matches the experimental site's other conditions (temperature, salinity, etc.). This provides a baseline to compare experimental results against.
(iii) Data to collect: Daily oyster survival counts (binary: alive/dead) over 8 weeks, and weekly measurements of oyster shell length (for growth). Also, weekly water nitrogen concentration tests to confirm the independent variable levels.
(iv) Expected results: As nitrogen concentration increases, oyster survival rate decreases, and oyster growth rate slows. Excess nitrogen can cause algal blooms that deplete oxygen, suffocating oysters, or disrupt their feeding.
Part (c)
Coastal flood control is an ecosystem service impacted by hog farm pollution. Excess nutrient runoff causes algal blooms that smother salt marsh grasses; these grasses stabilize shorelines and reduce flood risk by absorbing storm energy. Loss of grasses weakens this flood protection.
Part (d)
- Census tract-level mean annual income data (from official government sources like the U.S. Census Bureau) mapped to zip codes with high hog density, showing a statistically significant lower average income compared to low hog density zip codes.
- Survey data of household incomes from residents in high vs. low hog density areas, paired with the hog density data from the map, demonstrating a negative correlation between income levels and hog density.
Part (e)
Lower-income areas often have less political power to oppose industrial operations like hog farms, a concept called environmental injustice. Land and property values are lower in these areas, making it cheaper for farm operators to acquire land. Additionally, residents may have fewer economic alternatives, so they may accept hog farms as a source of local jobs even with environmental tradeoffs.

Snap & solve any problem in the app
Get step-by-step solutions on Sovi AI
Photo-based solutions with guided steps
Explore more problems and detailed explanations
(a) Nitrogen (from hog manure runoff)
(b)
(i) Independent variable: Nitrogen concentration in water; Dependent variable: Oyster survival/growth rate
(ii) Control group: Oysters in unpolluted coastal water (no added nitrogen)
(iii) Data: Weekly oyster survival counts, weekly oyster shell length measurements, weekly water nitrogen concentration tests
(iv) Expected results: Higher nitrogen concentrations lead to lower oyster survival and slower growth
(c) Coastal flood control (loss of salt marsh grasses due to nutrient pollution reduces shoreline stabilization)
(d) 1. Census tract-level mean annual income data linked to hog density zip codes; 2. Household income survey data paired with hog density map data
(e) Lower-income areas have weaker political opposition to hog farms, lower land costs for operators, and residents may rely on farm jobs with limited economic alternatives