QUESTION IMAGE
Question
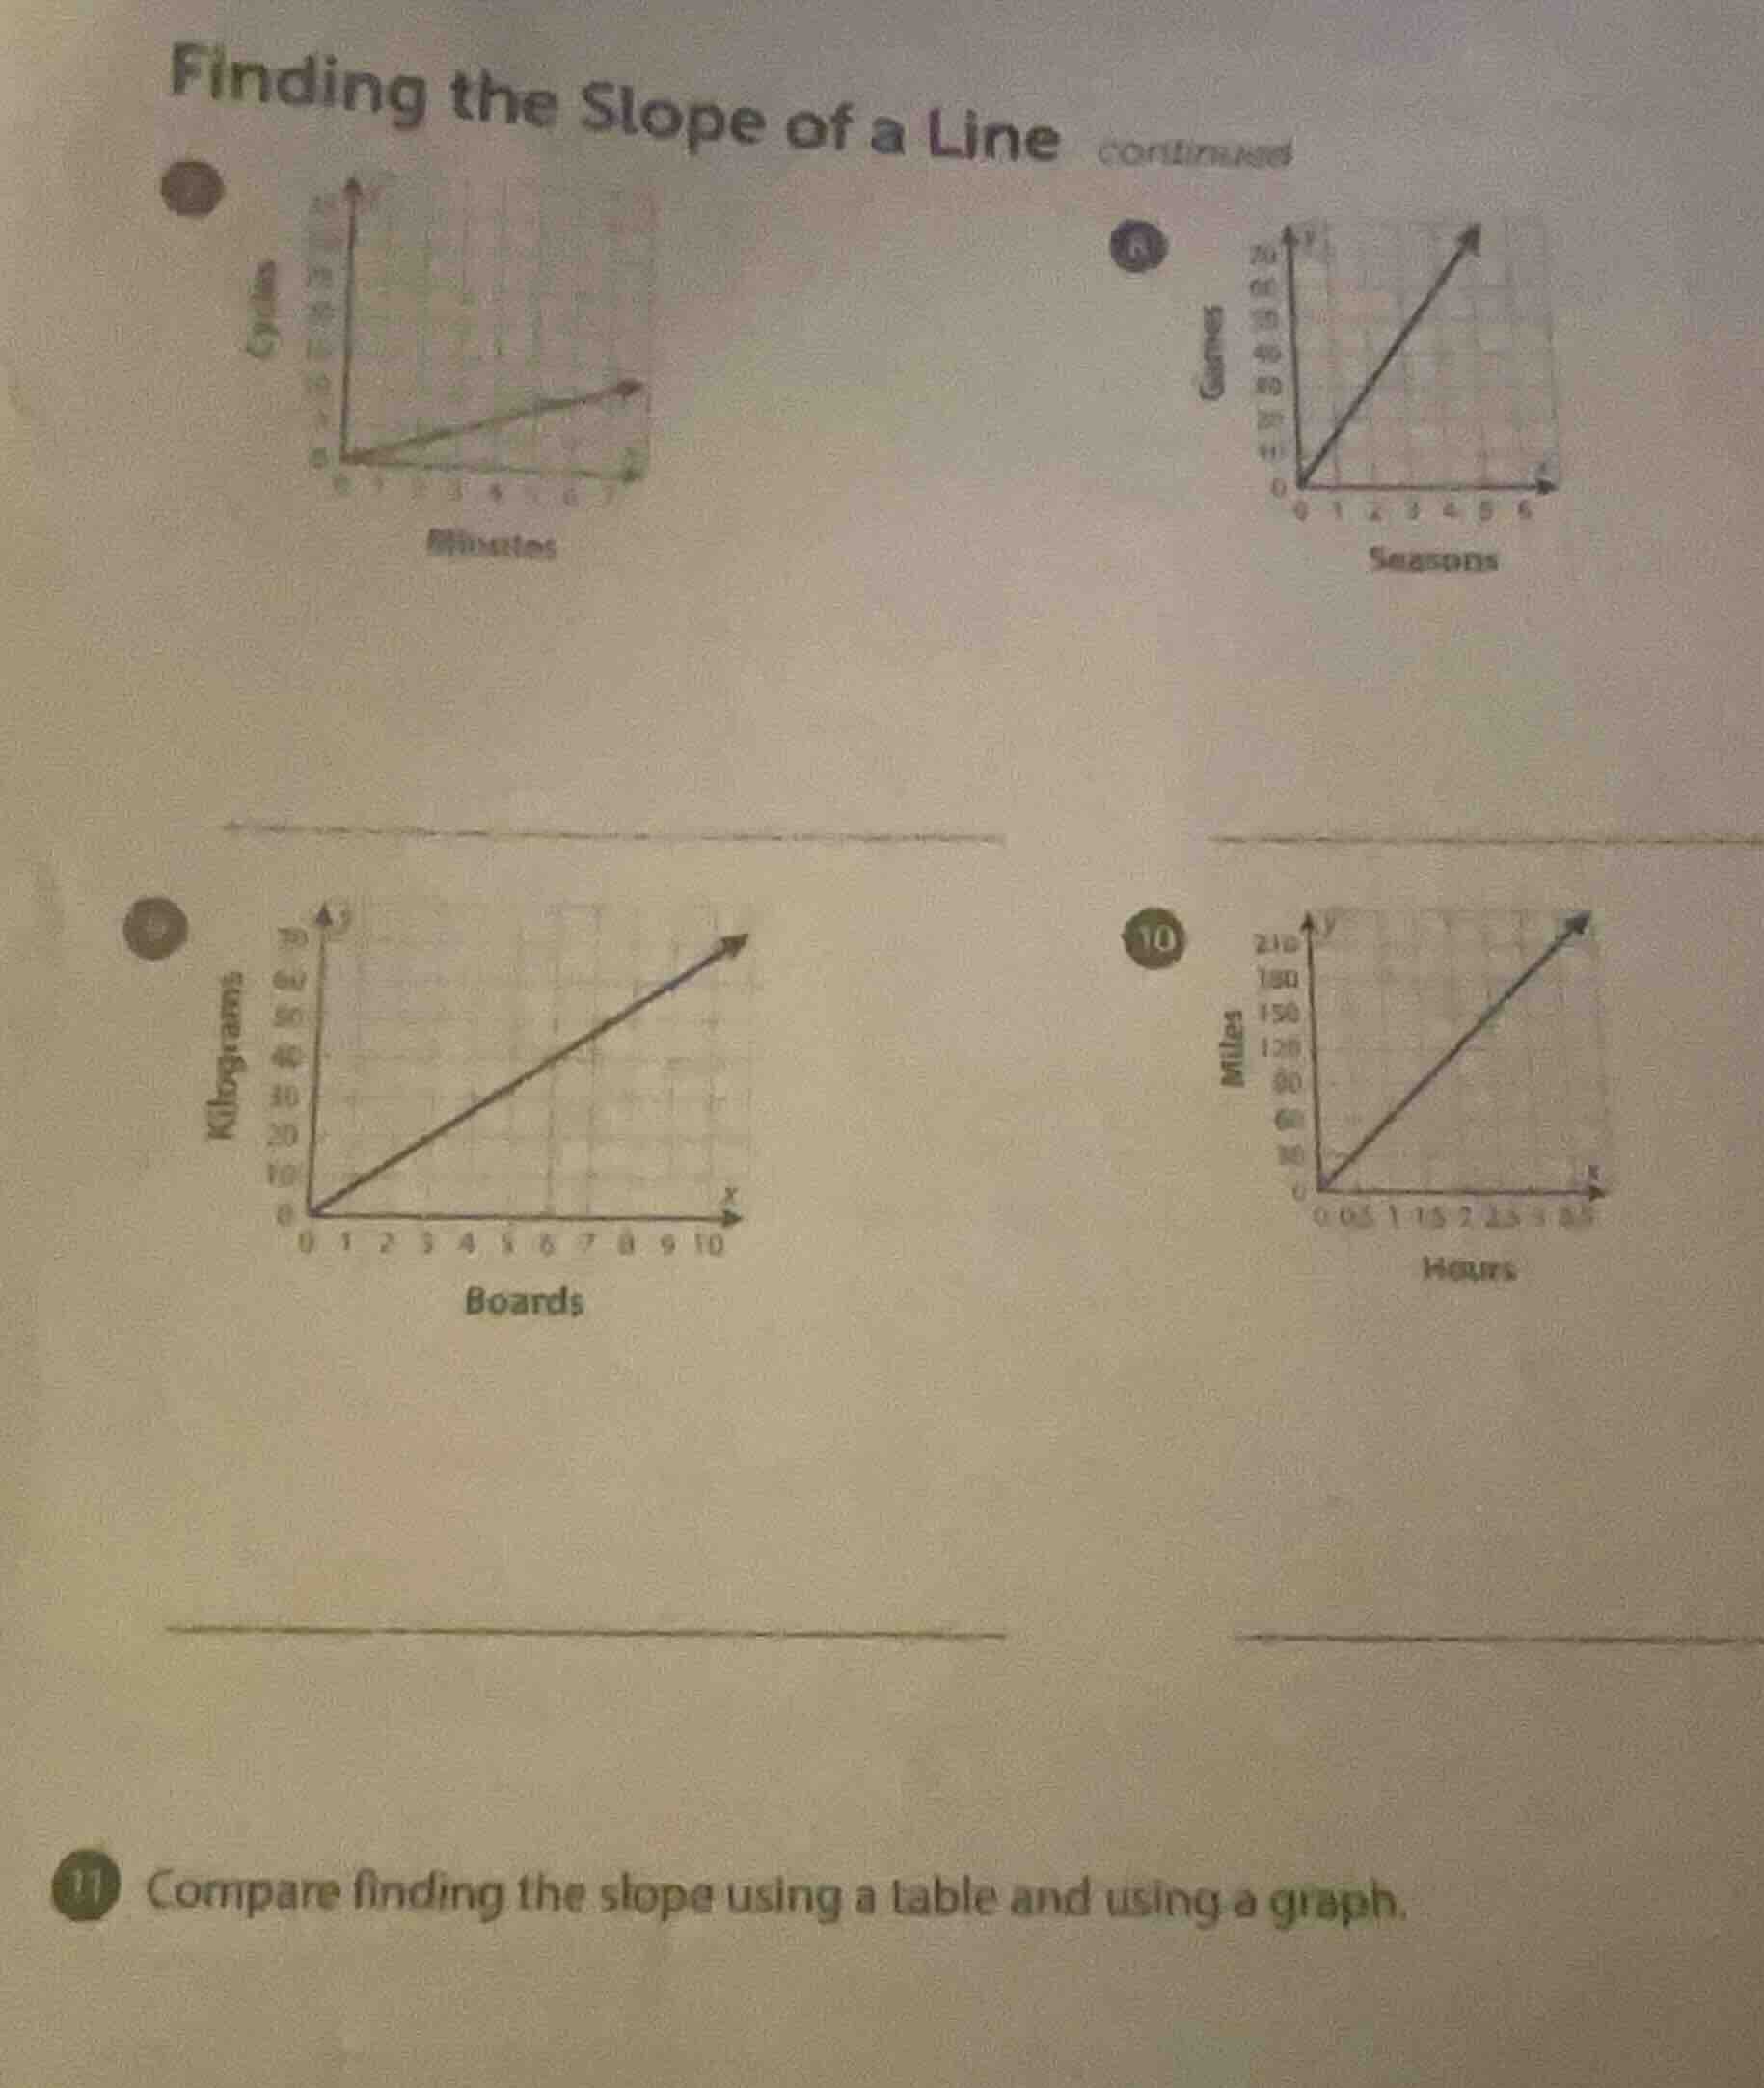
finding the slope of a line continued
7
8
9
10
11 compare finding the slope using a table and using a graph.
For Question 11 (Compare finding the slope using a table and using a graph)
- Using a Table: To find the slope from a table, we identify two ordered pairs \((x_1,y_1)\) and \((x_2,y_2)\) from the table. Then we use the slope formula \(m=\frac{y_2 - y_1}{x_2 - x_1}\). We calculate the difference in \(y\)-values (vertical change) and the difference in \(x\)-values (horizontal change) between the two points and divide them.
- Using a Graph: For a graph, we can either:
- Identify two points on the line (e.g., where the line crosses grid intersections for easier calculation). Then use the slope formula \(m = \frac{\text{rise}}{\text{run}}\), where "rise" is the vertical change (change in \(y\)) and "run" is the horizontal change (change in \(x\)) between the two points.
- Alternatively, we can visually determine the rate of change by seeing how much \(y\) changes for a given change in \(x\) (e.g., if for every 1 unit increase in \(x\), \(y\) increases by 2 units, the slope is 2).
- Similarities: Both methods rely on the slope formula \(m=\frac{\text{change in }y}{\text{change in }x}\) (or \(m=\frac{y_2 - y_1}{x_2 - x_1}\)). They both require identifying two points (either from the table or the graph) to calculate the rate of change between them.
- Differences:
- Source of Points: In a table, the points are given as ordered pairs (we just pick two rows). In a graph, we have to visually locate points (which might be easier or harder depending on the graph's clarity and if it passes through grid intersections).
- Visual vs. Numerical: Using a graph can be more intuitive for understanding the "steepness" visually (through rise over run), while using a table is more about numerical differences between given values.
- Accuracy: If the graph is not drawn to scale or the points don't lie on grid lines, calculating slope from a graph might be less accurate than from a table (where values are exact). If the graph is clear and points are on grid lines, it can be very straightforward.
Step 1: Identify two points on the line
From the graph, let's take \((x_1,y_1)=(0,0)\) and \((x_2,y_2)=(5, 100)\) (assuming when \(x = 5\) seasons, \(y = 100\) games).
Step 2: Apply the slope formula
The slope formula is \(m=\frac{y_2 - y_1}{x_2 - x_1}\). Substitute \(x_1 = 0\), \(y_1 = 0\), \(x_2 = 5\), \(y_2 = 100\).
\(m=\frac{100 - 0}{5 - 0}=\frac{100}{5}=20\)
Step 1: Identify two points
Take \((x_1,y_1)=(0,0)\) and \((x_2,y_2)=(10, 60)\).
Step 2: Use slope formula
\(m=\frac{y_2 - y_1}{x_2 - x_1}=\frac{60 - 0}{10 - 0}=\frac{60}{10}=6\)

Snap & solve any problem in the app
Get step-by-step solutions on Sovi AI
Photo-based solutions with guided steps
Explore more problems and detailed explanations
- Using a Table: Select two ordered pairs \((x_1,y_1)\), \((x_2,y_2)\) from the table. Use \(m=\frac{y_2 - y_1}{x_2 - x_1}\).
- Using a Graph: Identify two points on the line. Use \(m=\frac{\text{rise}}{\text{run}}\) (vertical change over horizontal change between the points).
- Similarities: Both use \(m=\frac{\Delta y}{\Delta x}\) (change in \(y\) over change in \(x\)) and require two points.
- Differences: Table uses given ordered pairs; graph uses visually identified points (easier to see steepness, but accuracy depends on graph clarity).
For Finding Slope of the Lines (assuming we take one example, say Problem 8: "Games vs. Seasons" graph)
Let's assume the graph for Problem 8 has points like \((0,0)\) and \((5, 100)\) (assuming the y-axis is "Games" with values 0,40,80,120... and x-axis "Seasons" 0 - 6).