QUESTION IMAGE
Question
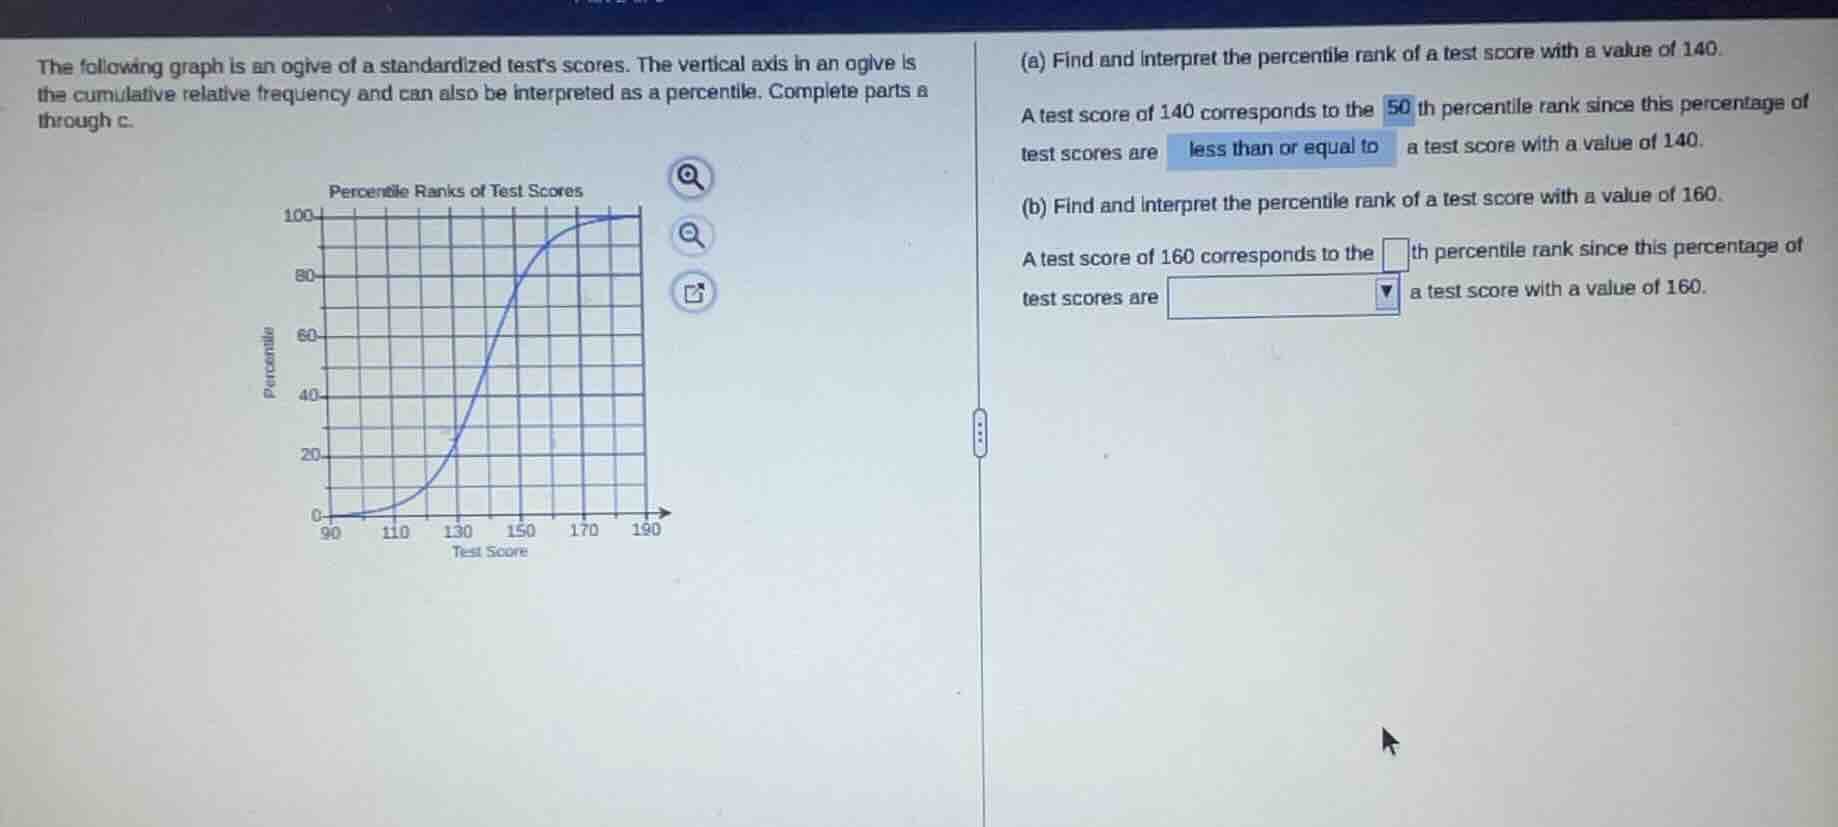
the following graph is an ogive of a standardized tests scores. the vertical axis in an ogive is the cumulative relative frequency and can also be interpreted as a percentile. complete parts a through c.
(a) find and interpret the percentile rank of a test score with a value of 140.
a test score of 140 corresponds to the 50 th percentile rank since this percentage of test scores are less than or equal to a test score with a value of 140.
(b) find and interpret the percentile rank of a test score with a value of 160.
a test score of 160 corresponds to the th percentile rank since this percentage of test scores are a test score with a value of 160.
Step1: Locate 160 on x-axis
Find test score 160 on horizontal axis.
Step2: Find corresponding percentile
Move vertically up to the ogive, then horizontally left to the vertical axis. The value is 90.
Step3: Interpret the percentile rank
Ogive shows cumulative relative frequency (percentile), meaning this percentage of scores are less than or equal to 160.

Snap & solve any problem in the app
Get step-by-step solutions on Sovi AI
Photo-based solutions with guided steps
Explore more problems and detailed explanations
A test score of 160 corresponds to the 90 th percentile rank since this percentage of test scores are less than or equal to a test score with a value of 160.