QUESTION IMAGE
Question
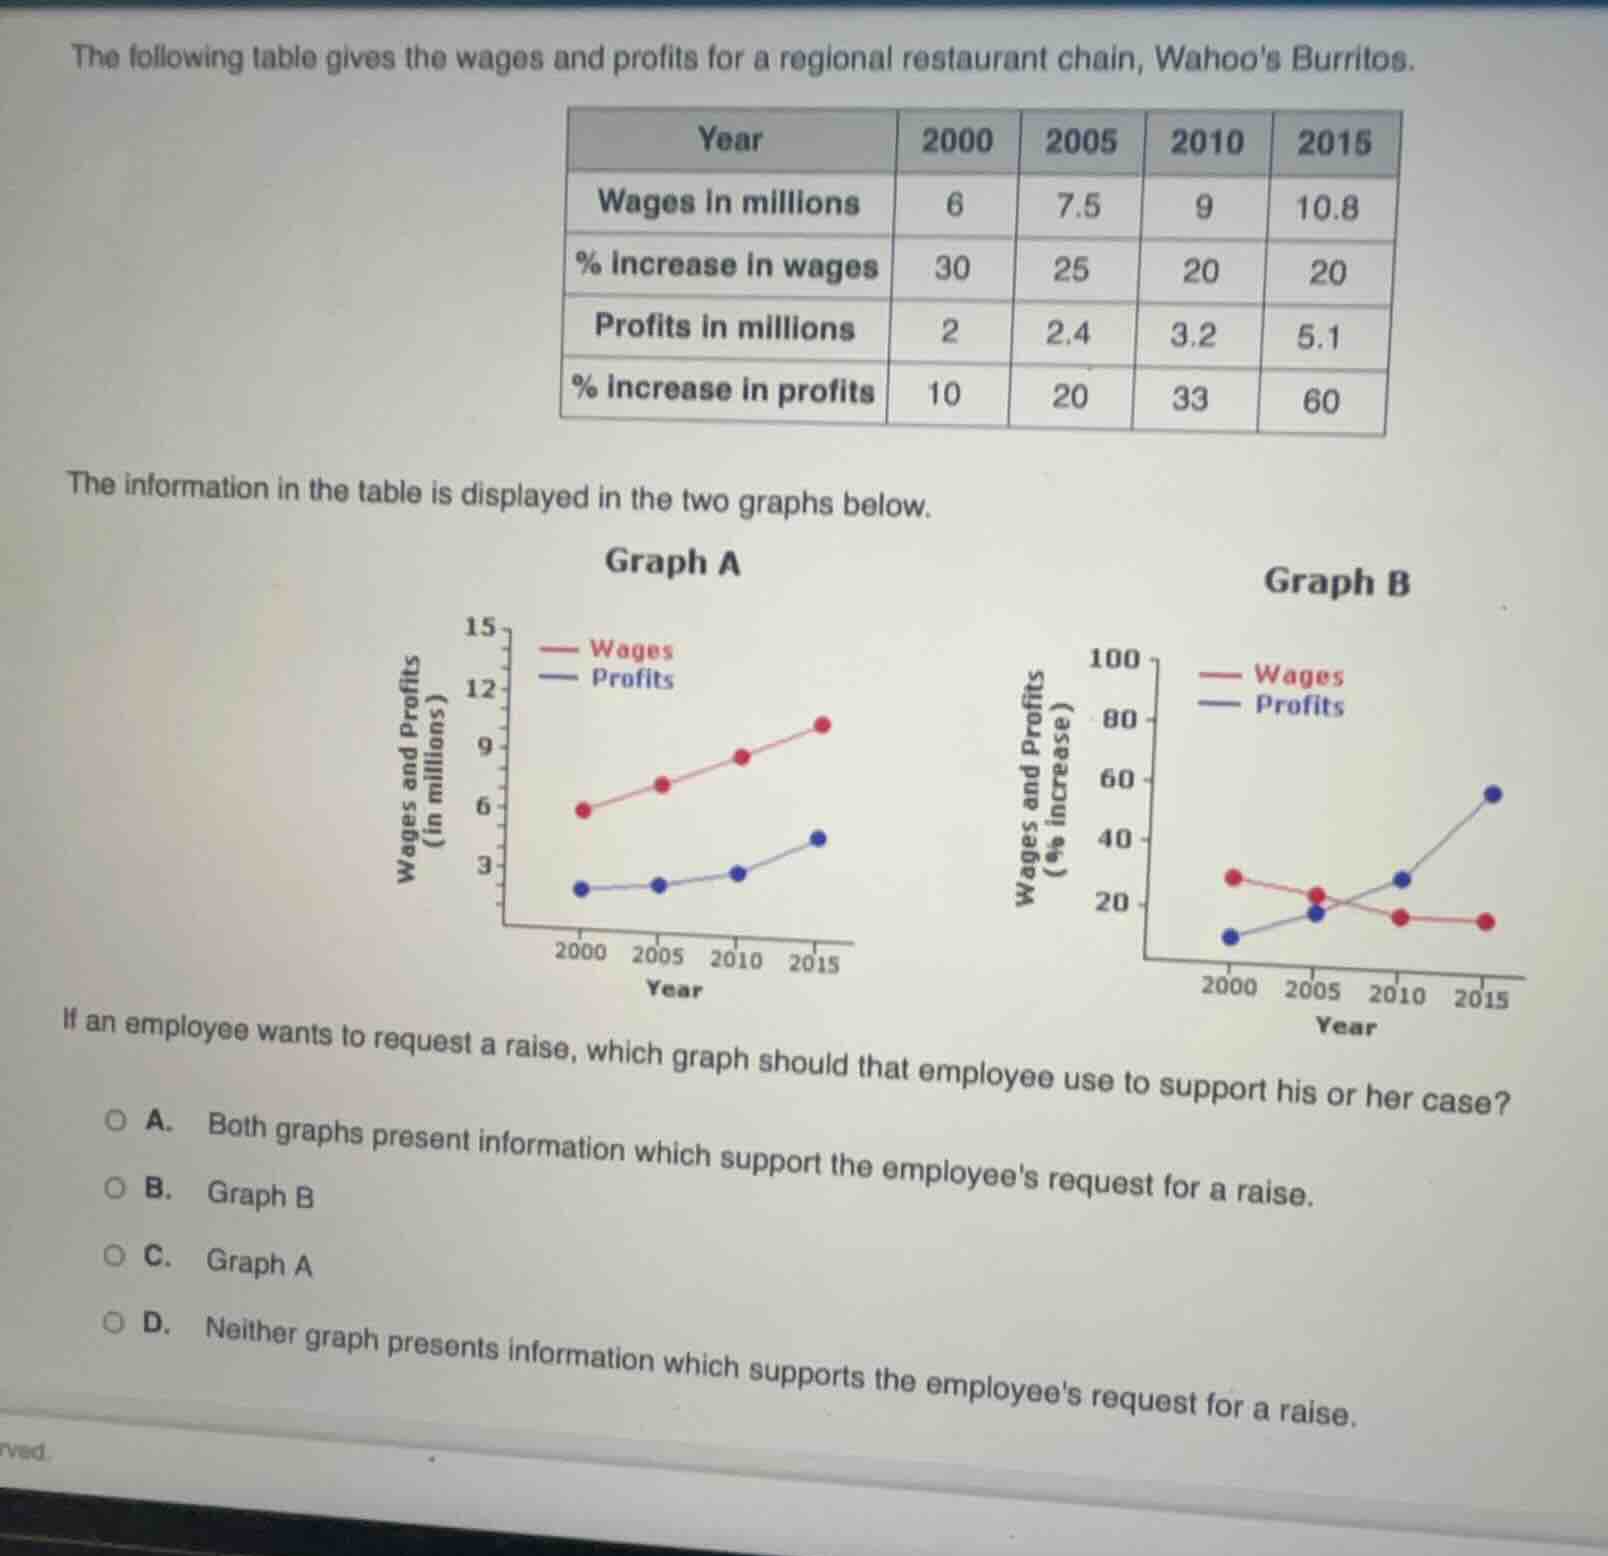
the following table gives the wages and profits for a regional restaurant chain, wahoos burritos.
| year | 2000 | 2005 | 2010 | 2015 | ---- | ---- | ---- | ---- | ---- | wages in millions | 6 | 7.5 | 9 | 10.8 | % increase in wages | 30 | 25 | 20 | 20 | profits in millions | 2 | 2.4 | 3.2 | 5.1 | % increase in profits | 10 | 20 | 33 | 60 | the information in the table is displayed in the two graphs below.graph agraph bif an employee wants to request a raise, which graph should that employee use to support his or her case?a. both graphs present information which support the employees request for a raise.b. graph bc. graph ad. neither graph presents information which supports the employees request for a raise. |
Graph A shows the total wages and profits in millions. It demonstrates that while wages have grown, profits have also increased, but more importantly, the wage amount is still lower than profits, and the restaurant's overall wage spending has risen, but to argue for a raise, Graph B is more effective: it shows that the percentage increase in wages has been declining/stagnating (from 30% to 20%) while the percentage increase in profits has skyrocketed (from 10% to 60%). This contrast supports the case that the company's profitability growth far outpaces wage growth, justifying a raise.

Snap & solve any problem in the app
Get step-by-step solutions on Sovi AI
Photo-based solutions with guided steps
Explore more problems and detailed explanations
B. Graph B