QUESTION IMAGE
Question
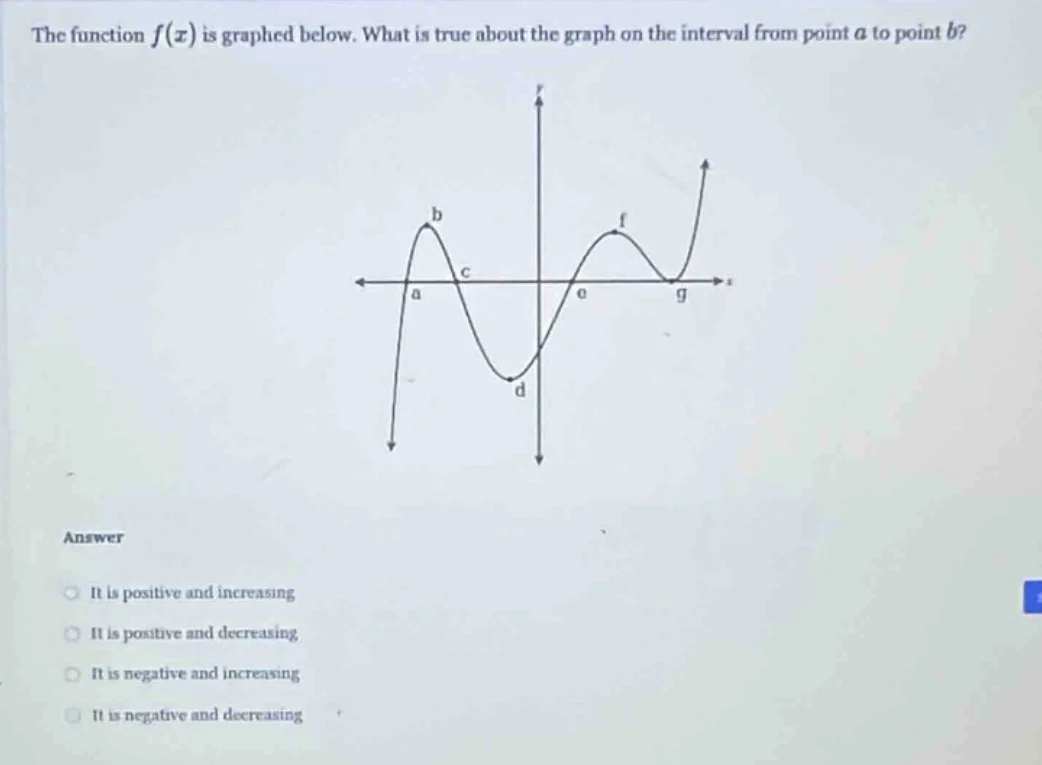
the function $f(x)$ is graphed below. what is true about the graph on the interval from point $a$ to point $b$?
answer
- it is positive and increasing
- it is positive and decreasing
- it is negative and increasing
- it is negative and decreasing
Brief Explanations
- First, check the sign of the function between points $a$ and $b$: the graph lies above the $x$-axis, so $f(x)$ is positive here.
- Next, check the trend: as $x$ moves from $a$ to $b$ (rightward along the $x$-axis), the $y$-values of the graph increase, meaning the function is increasing.

Snap & solve any problem in the app
Get step-by-step solutions on Sovi AI
Photo-based solutions with guided steps
Explore more problems and detailed explanations
It is positive and increasing