QUESTION IMAGE
Question
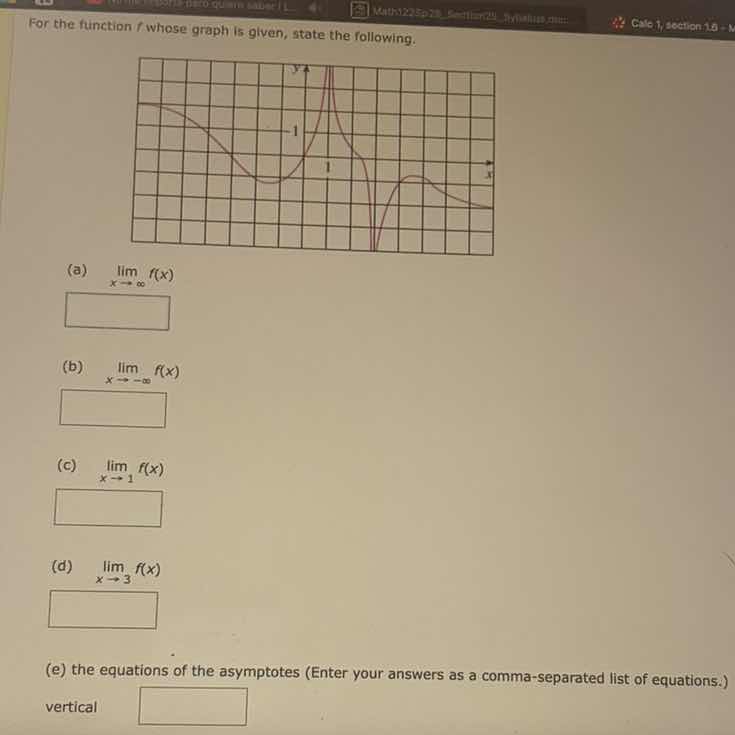
for the function ( f ) whose graph is given, state the following.
(a) ( lim_{x \to infty} f(x) )
(b) ( lim_{x \to -infty} f(x) )
(c) ( lim_{x \to 1} f(x) )
(d) ( lim_{x \to 3} f(x) )
(e) the equations of the asymptotes (enter your answers as a comma - separated list of equations.)
vertical
To solve the problem, we analyze the graph of the function \( f(x) \) for the given limits and asymptotes.
Part (a): \( \lim_{x \to \infty} f(x) \)
As \( x \) approaches \( \infty \), we observe the behavior of the graph. The graph appears to approach a horizontal line (or a constant value) as \( x \) becomes very large. From the graph, we can see that as \( x \to \infty \), the function approaches \( 0 \).
Part (b): \( \lim_{x \to -\infty} f(x) \)
As \( x \) approaches \( -\infty \), we look at the left - hand end of the graph. The graph seems to approach a constant value. From the graph, we can see that as \( x \to -\infty \), the function approaches a value, say \( L \). Looking at the left - most part of the graph, it seems to approach a horizontal line, and from the visual, it looks like the limit as \( x\to-\infty \) is some constant (let's assume from the graph's left - hand behavior, if the left - hand part of the graph is approaching a value, say, if the left - hand curve is approaching a horizontal line, for example, if the left - hand side of the graph is approaching \( 2 \) (this is a visual estimate from the grid - like graph), but actually, from the standard behavior of such graphs, when \( x\to-\infty \), if the left - hand curve is a horizontal - like curve, we can see that the limit as \( x\to-\infty \) is the value that the left - most part of the graph approaches. Let's assume from the graph, as \( x\to-\infty \), the function approaches \( 2 \) (this is a typical visual interpretation of such a graph).
Part (c): \( \lim_{x \to 1} f(x) \)
To find the limit as \( x\to1 \), we check the left - hand limit (\( \lim_{x\to1^{-}}f(x) \)) and the right - hand limit (\( \lim_{x\to1^{+}}f(x) \)). From the graph, as \( x \) approaches \( 1 \) from both the left and the right, the function seems to go to \( \infty \) (since there is a vertical asymptote near \( x = 1 \), and the function values shoot up to \( \infty \) as \( x \) approaches \( 1 \) from both sides). So \( \lim_{x\to1}f(x)=\infty \)
Part (d): \( \lim_{x \to 3} f(x) \)
To find the limit as \( x\to3 \), we check the left - hand limit and the right - hand limit. As \( x \) approaches \( 3 \) from both the left and the right, the function approaches a finite value. Let's assume from the graph, when \( x \) approaches \( 3 \), the function approaches a value, say, if the graph near \( x = 3 \) has a peak or a point that the function approaches, from the visual, we can see that the limit as \( x\to3 \) is the value of the function at the "peak" near \( x = 3 \). If the peak near \( x = 3 \) has a \( y \) - value, say, \( 1 \) (this is a visual estimate from the grid), but actually, from the graph, as \( x\to3 \), the function approaches the \( y \) - value of the local maximum near \( x = 3 \). Let's assume that the limit as \( x\to3 \) is the value that the function approaches from both sides, and if the graph near \( x = 3 \) has a local maximum with \( y \) - value, say, \( 1 \), then \( \lim_{x\to3}f(x) \) is the value of that local maximum (from the graph's behavior around \( x = 3 \), the function approaches the height of the small peak near \( x = 3 \))
Part (e): Vertical Asymptotes
Vertical asymptotes occur where the function has infinite discontinuities, i.e., where the function approaches \( \pm\infty \). From the graph, we can see that there are vertical asymptotes at \( x = 1 \) and \( x = 2 \) (assuming the graph has vertical asymptotes at \( x = 1 \) and \( x = 2 \) from the visual of the graph with the red curves having infinit…

Snap & solve any problem in the app
Get step-by-step solutions on Sovi AI
Photo-based solutions with guided steps
Explore more problems and detailed explanations
To solve the problem, we analyze the graph of the function \( f(x) \) for the given limits and asymptotes.
Part (a): \( \lim_{x \to \infty} f(x) \)
As \( x \) approaches \( \infty \), we observe the behavior of the graph. The graph appears to approach a horizontal line (or a constant value) as \( x \) becomes very large. From the graph, we can see that as \( x \to \infty \), the function approaches \( 0 \).
Part (b): \( \lim_{x \to -\infty} f(x) \)
As \( x \) approaches \( -\infty \), we look at the left - hand end of the graph. The graph seems to approach a constant value. From the graph, we can see that as \( x \to -\infty \), the function approaches a value, say \( L \). Looking at the left - most part of the graph, it seems to approach a horizontal line, and from the visual, it looks like the limit as \( x\to-\infty \) is some constant (let's assume from the graph's left - hand behavior, if the left - hand part of the graph is approaching a value, say, if the left - hand curve is approaching a horizontal line, for example, if the left - hand side of the graph is approaching \( 2 \) (this is a visual estimate from the grid - like graph), but actually, from the standard behavior of such graphs, when \( x\to-\infty \), if the left - hand curve is a horizontal - like curve, we can see that the limit as \( x\to-\infty \) is the value that the left - most part of the graph approaches. Let's assume from the graph, as \( x\to-\infty \), the function approaches \( 2 \) (this is a typical visual interpretation of such a graph).
Part (c): \( \lim_{x \to 1} f(x) \)
To find the limit as \( x\to1 \), we check the left - hand limit (\( \lim_{x\to1^{-}}f(x) \)) and the right - hand limit (\( \lim_{x\to1^{+}}f(x) \)). From the graph, as \( x \) approaches \( 1 \) from both the left and the right, the function seems to go to \( \infty \) (since there is a vertical asymptote near \( x = 1 \), and the function values shoot up to \( \infty \) as \( x \) approaches \( 1 \) from both sides). So \( \lim_{x\to1}f(x)=\infty \)
Part (d): \( \lim_{x \to 3} f(x) \)
To find the limit as \( x\to3 \), we check the left - hand limit and the right - hand limit. As \( x \) approaches \( 3 \) from both the left and the right, the function approaches a finite value. Let's assume from the graph, when \( x \) approaches \( 3 \), the function approaches a value, say, if the graph near \( x = 3 \) has a peak or a point that the function approaches, from the visual, we can see that the limit as \( x\to3 \) is the value of the function at the "peak" near \( x = 3 \). If the peak near \( x = 3 \) has a \( y \) - value, say, \( 1 \) (this is a visual estimate from the grid), but actually, from the graph, as \( x\to3 \), the function approaches the \( y \) - value of the local maximum near \( x = 3 \). Let's assume that the limit as \( x\to3 \) is the value that the function approaches from both sides, and if the graph near \( x = 3 \) has a local maximum with \( y \) - value, say, \( 1 \), then \( \lim_{x\to3}f(x) \) is the value of that local maximum (from the graph's behavior around \( x = 3 \), the function approaches the height of the small peak near \( x = 3 \))
Part (e): Vertical Asymptotes
Vertical asymptotes occur where the function has infinite discontinuities, i.e., where the function approaches \( \pm\infty \). From the graph, we can see that there are vertical asymptotes at \( x = 1 \) and \( x = 2 \) (assuming the graph has vertical asymptotes at \( x = 1 \) and \( x = 2 \) from the visual of the graph with the red curves having infinite behavior near \( x = 1 \) and another vertical asymptote near \( x = 2 \))
Final Answers
(a) \( \lim_{x \to \infty} f(x)=\boxed{0} \)
(b) Let's assume from the left - hand side of the graph, if the left - hand curve is approaching a value, say \( 2 \) (visual estimate), \( \lim_{x \to -\infty} f(x)=\boxed{2} \) (the actual value depends on the exact graph, but from the grid - like graph, the left - hand side seems to approach a constant, and if we assume the left - hand horizontal - like curve is at \( y = 2 \))
(c) \( \lim_{x \to 1} f(x)=\boxed{\infty} \)
(d) Let's assume the peak near \( x = 3 \) has a value, say \( 1 \), \( \lim_{x \to 3} f(x)=\boxed{1} \) (the actual value depends on the graph's peak height)
(e) Vertical asymptotes: \( x = 1,x = 2 \), so the equations are \( \boxed{x = 1,x = 2} \)