QUESTION IMAGE
Question
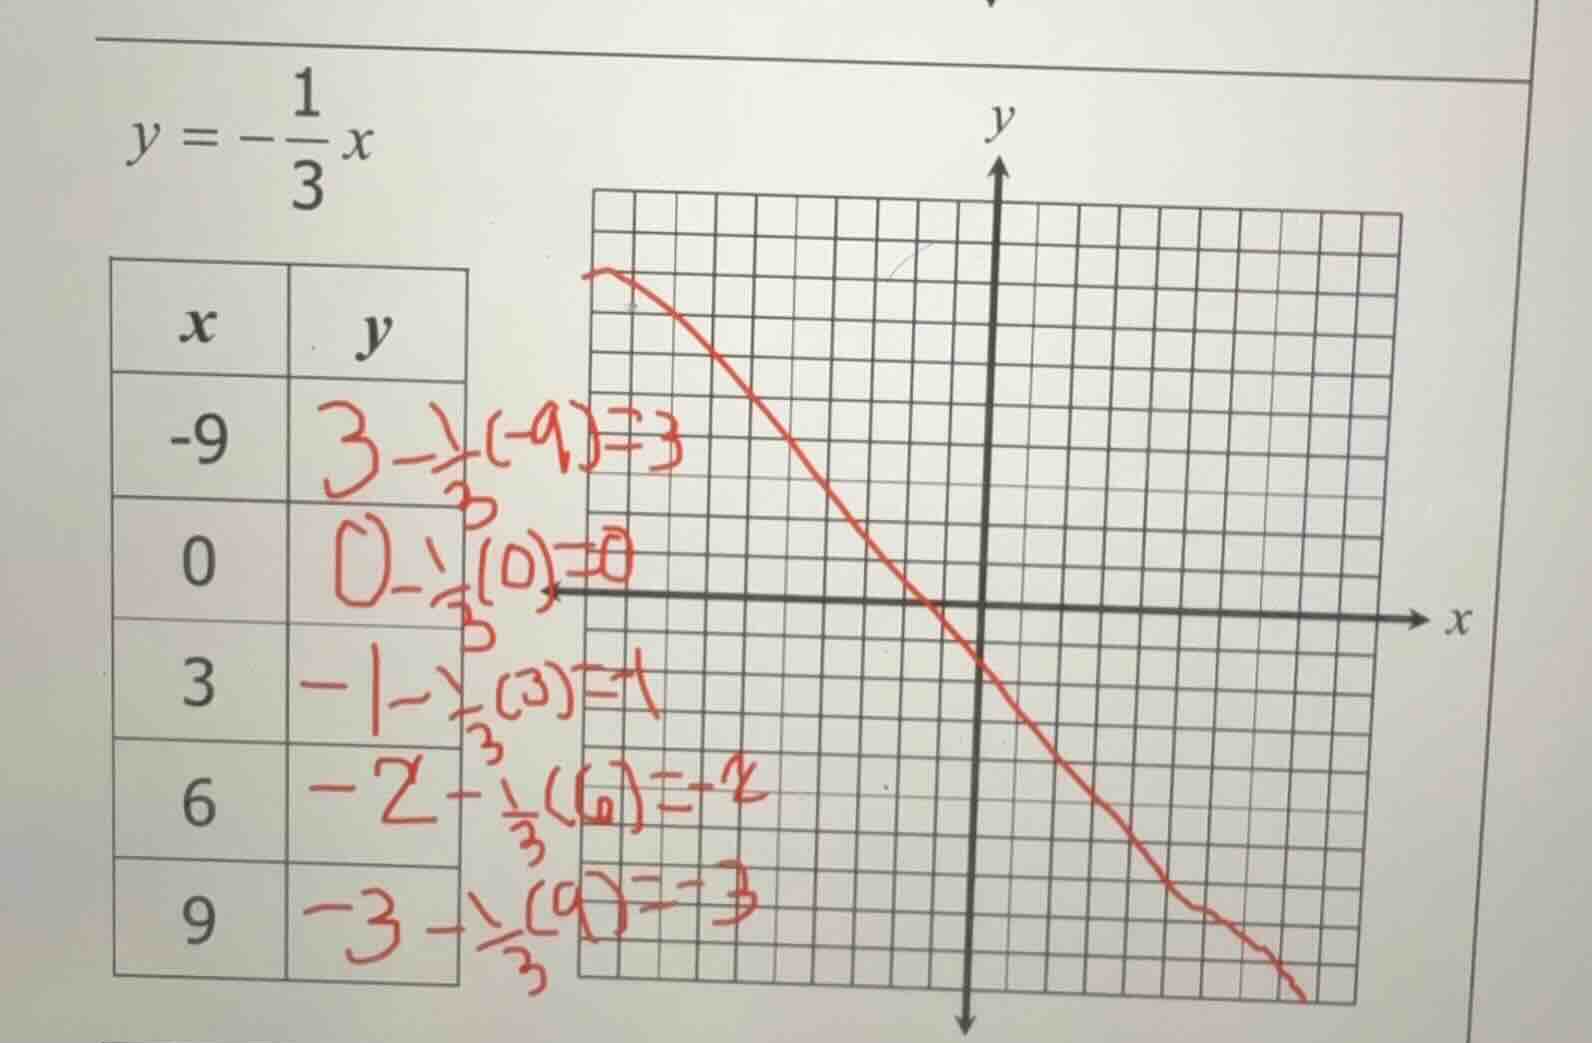
given the equation $y = -\frac{1}{3}x$, and a table with $x$ values -9, 0, 3, 6, 9, and a coordinate grid with a red line plotted. the table has corresponding $y$ values calculated (e.g., for $x=-9$, $y$ is calculated as $-\frac{1}{3}(-9)=3$; for $x = 0$, $y=-\frac{1}{3}(0)=0$; etc.).
Step1: Substitute $x=-9$ into equation
$y = -\frac{1}{3} \times (-9) = 3$
Step2: Substitute $x=0$ into equation
$y = -\frac{1}{3} \times 0 = 0$
Step3: Substitute $x=3$ into equation
$y = -\frac{1}{3} \times 3 = -1$
Step4: Substitute $x=6$ into equation
$y = -\frac{1}{3} \times 6 = -2$
Step5: Substitute $x=9$ into equation
$y = -\frac{1}{3} \times 9 = -3$

Snap & solve any problem in the app
Get step-by-step solutions on Sovi AI
Photo-based solutions with guided steps
Explore more problems and detailed explanations
The completed table is:
| $x$ | $y$ |
|---|---|
| $0$ | $0$ |
| $3$ | $-1$ |
| $6$ | $-2$ |
| $9$ | $-3$ |
The graphed line matches the linear function $y=-\frac{1}{3}x$, as it passes through all the calculated points.