QUESTION IMAGE
Question
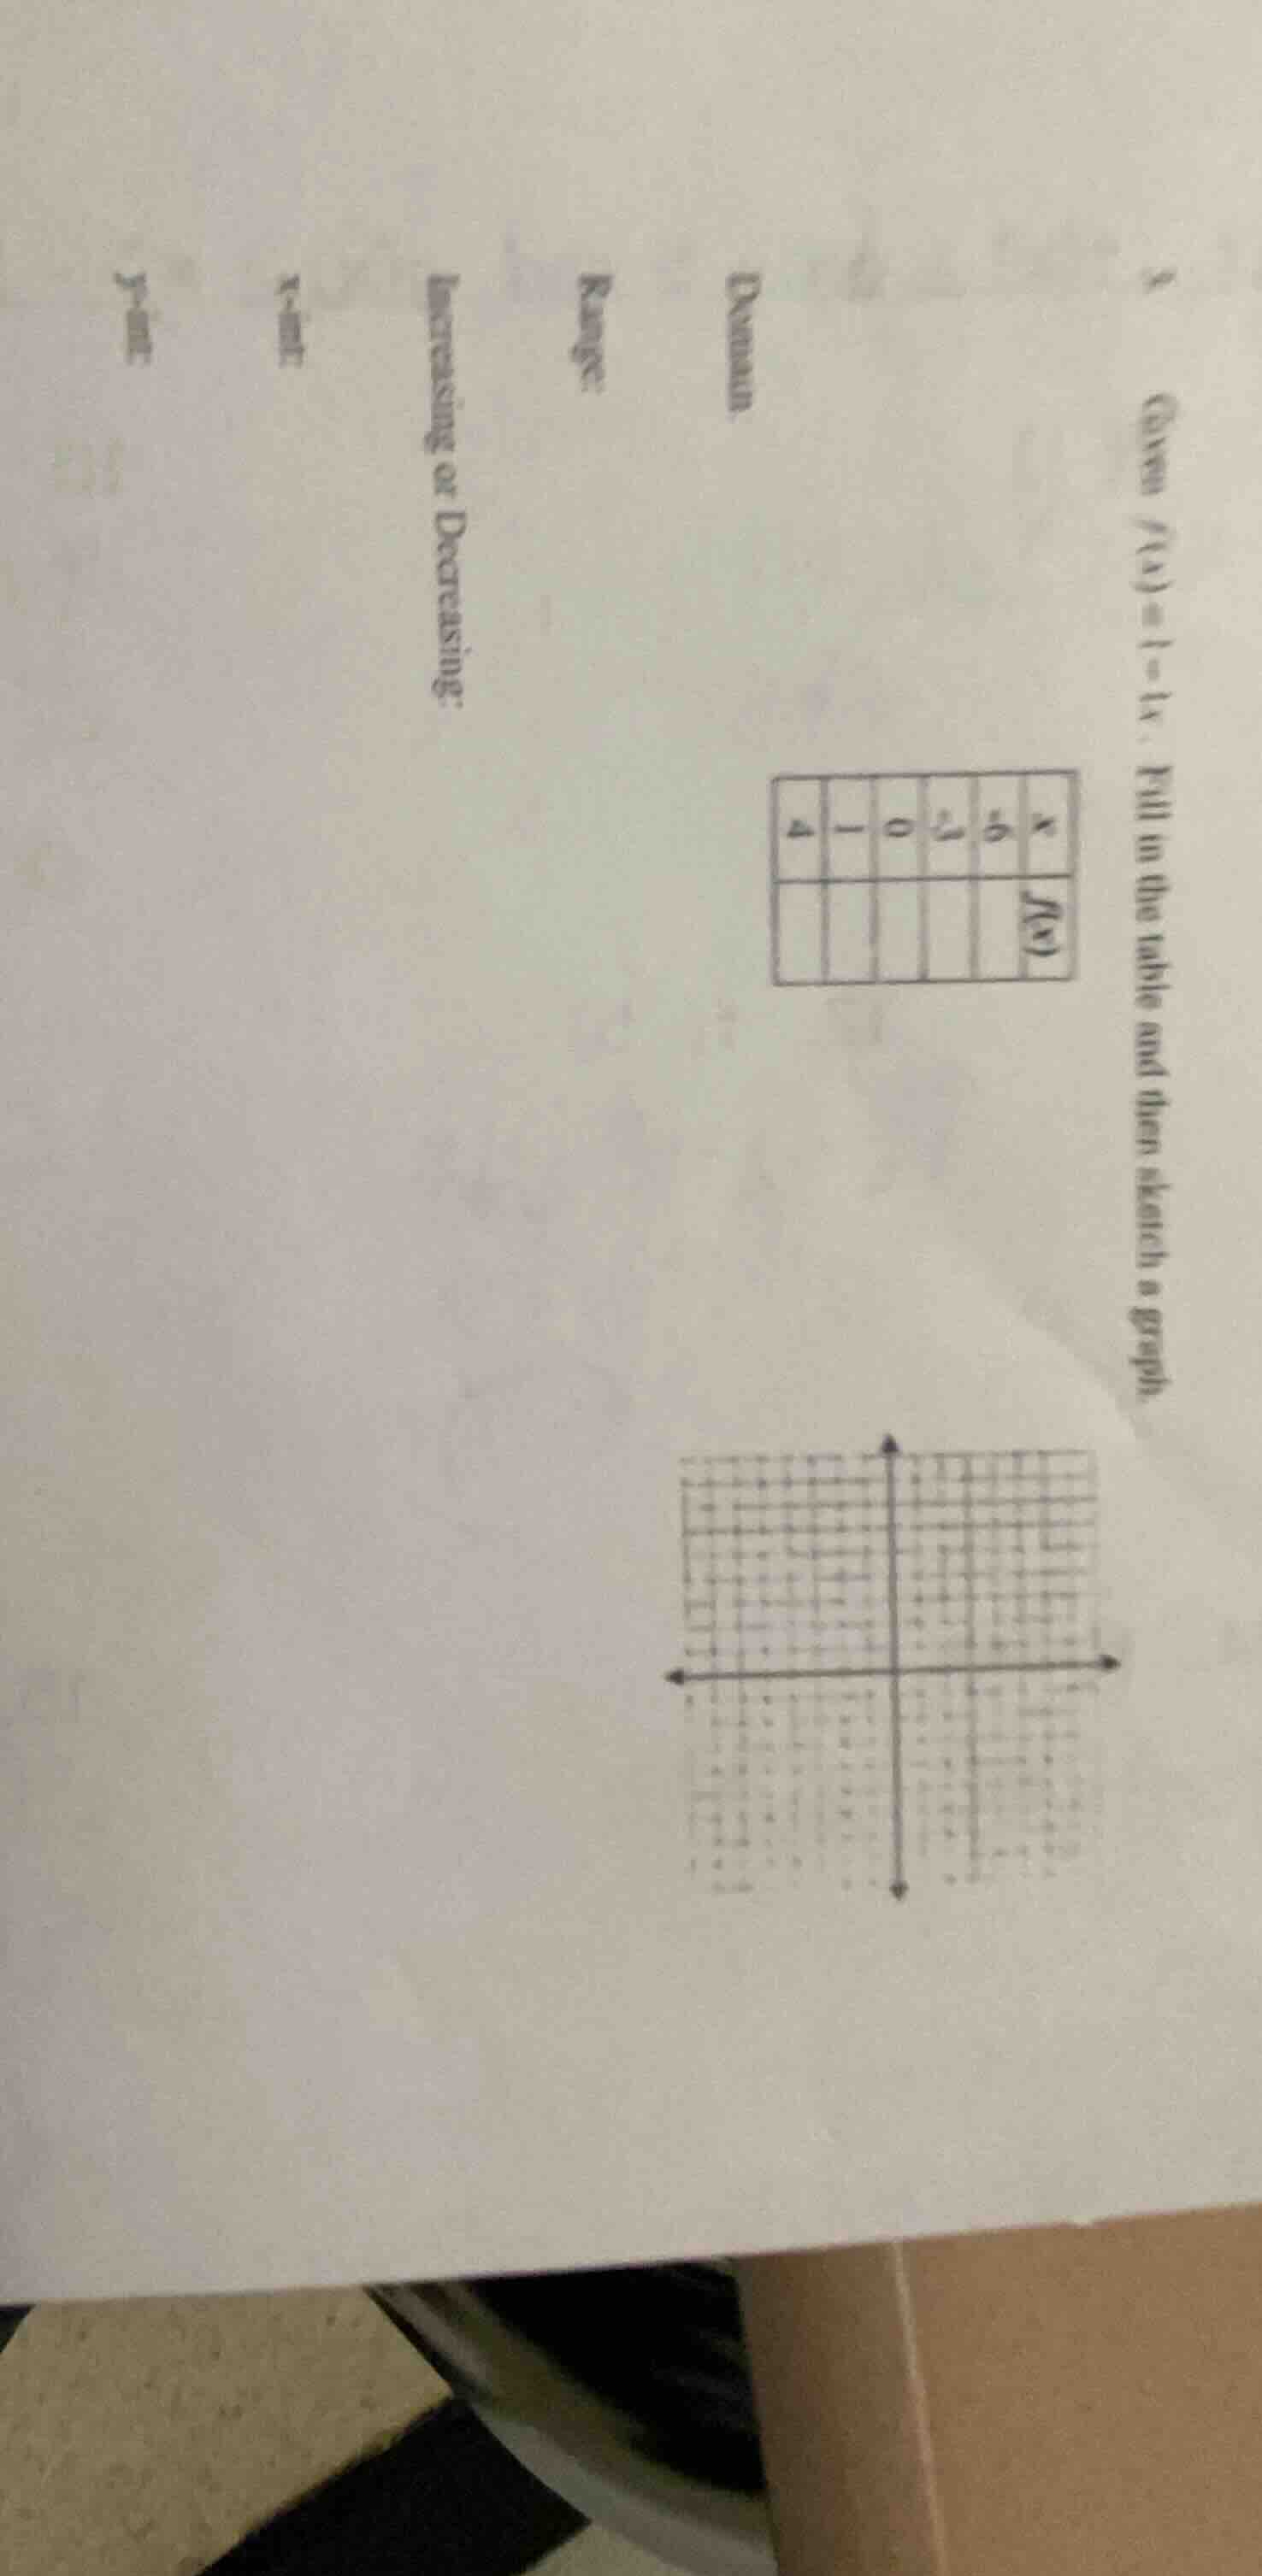
- given ( f(x) = 1 - \frac{1}{4}x ). fill in the table and then sketch a graph.
domain
range
increasing or decreasing
x - int
y - int
| x | -6 | -3 | 0 | 1 | 4 |
|---|
(graph grid below)
Step1: Identify the function
The function is \( f(x) = 1 - \frac{1}{4}x \) (assuming the original is \( f(x)=1-\frac{1}{4}x \) as the image might have a typo, if it's \( f(x) = 1 - 4x \), the process is similar). Let's proceed with \( f(x)=1-\frac{1}{4}x \).
Step2: Fill the table for given x values
Given \( x \) values: -6, -3, 0, 1, 4.
- For \( x = -6 \):
\( f(-6)=1-\frac{1}{4}(-6)=1 + \frac{6}{4}=1+\frac{3}{2}=\frac{5}{2}=2.5 \)
- For \( x = -3 \):
\( f(-3)=1-\frac{1}{4}(-3)=1+\frac{3}{4}=\frac{7}{4}=1.75 \)
- For \( x = 0 \):
\( f(0)=1-\frac{1}{4}(0)=1 \)
- For \( x = 1 \):
\( f(1)=1-\frac{1}{4}(1)=1 - \frac{1}{4}=\frac{3}{4}=0.75 \)
- For \( x = 4 \):
\( f(4)=1-\frac{1}{4}(4)=1 - 1 = 0 \)
If the function was \( f(x)=1 - 4x \):
- For \( x = -6 \):
\( f(-6)=1-4(-6)=1 + 24 = 25 \)
- For \( x = -3 \):
\( f(-3)=1-4(-3)=1 + 12 = 13 \)
- For \( x = 0 \):
\( f(0)=1-4(0)=1 \)
- For \( x = 1 \):
\( f(1)=1-4(1)=1 - 4=-3 \)
- For \( x = 4 \):
\( f(4)=1-4(4)=1 - 16=-15 \)
Assuming the intended function is \( f(x)=1 - \frac{1}{4}x \) (linear function with slope \( -\frac{1}{4} \)) or \( f(x)=1 - 4x \) (slope -4). Let's continue with the first assumption for the table.
Step3: Determine Domain, Range, Increasing/Decreasing, x-intercept, y-intercept
Domain:
For a linear function \( f(x)=mx + b \), the domain is all real numbers, \( (-\infty, \infty) \) or \( \mathbb{R} \).
Range:
For a linear function with real slope, the range is also all real numbers, \( (-\infty, \infty) \) or \( \mathbb{R} \).
Increasing or Decreasing:
The slope \( m = -\frac{1}{4} \) (or -4 for the other function) is negative, so the function is decreasing.
x-intercept:
Set \( f(x)=0 \), \( 1-\frac{1}{4}x = 0 \Rightarrow \frac{1}{4}x = 1 \Rightarrow x = 4 \). So x-intercept is (4, 0).
y-intercept:
Set \( x = 0 \), \( f(0)=1 \), so y-intercept is (0, 1).
Sketching the graph:
Plot the points from the table: (-6, 2.5), (-3, 1.75), (0, 1), (1, 0.75), (4, 0). Then draw a straight line through them (since it's a linear function).

Snap & solve any problem in the app
Get step-by-step solutions on Sovi AI
Photo-based solutions with guided steps
Explore more problems and detailed explanations
Table (for \( f(x)=1-\frac{1}{4}x \)):
| \( x \) | -6 | -3 | 0 | 1 | 4 |
|---|
Domain: \( (-\infty, \infty) \)
Range: \( (-\infty, \infty) \)
Increasing or Decreasing: Decreasing
x-intercept: \( (4, 0) \)
y-intercept: \( (0, 1) \)
(If the function was \( f(x)=1 - 4x \), the table values would be 25, 13, 1, -3, -15, x-intercept \( (\frac{1}{4}, 0) \), y-intercept (0,1), still decreasing.)