QUESTION IMAGE
Question
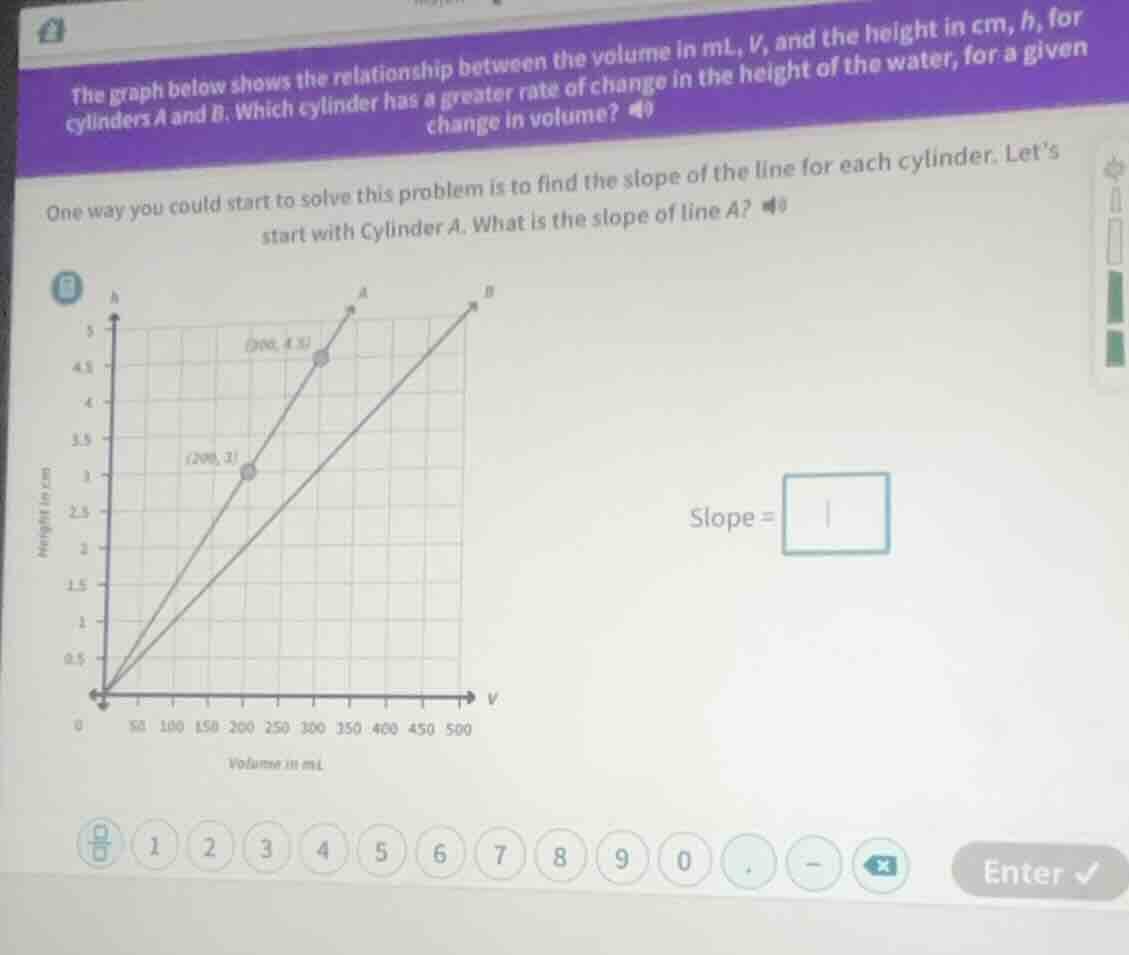
the graph below shows the relationship between the volume in ml, v, and the height in cm, h, for cylinders a and b. which cylinder has a greater rate of change in the height of the water, for a given change in volume? one way you could start to solve this problem is to find the slope of the line for each cylinder. lets start with cylinder a. what is the slope of line a? slope =
Step1: Recall slope formula
Slope $m = \frac{h_2 - h_1}{V_2 - V_1}$
Step2: Pick points for Cylinder A
Use $(V_1, h_1)=(200, 3)$ and $(V_2, h_2)=(400, 4.5)$
Step3: Calculate slope
$m = \frac{4.5 - 3}{400 - 200} = \frac{1.5}{200} = 0.0075$

Snap & solve any problem in the app
Get step-by-step solutions on Sovi AI
Photo-based solutions with guided steps
Explore more problems and detailed explanations
$0.0075$