QUESTION IMAGE
Question
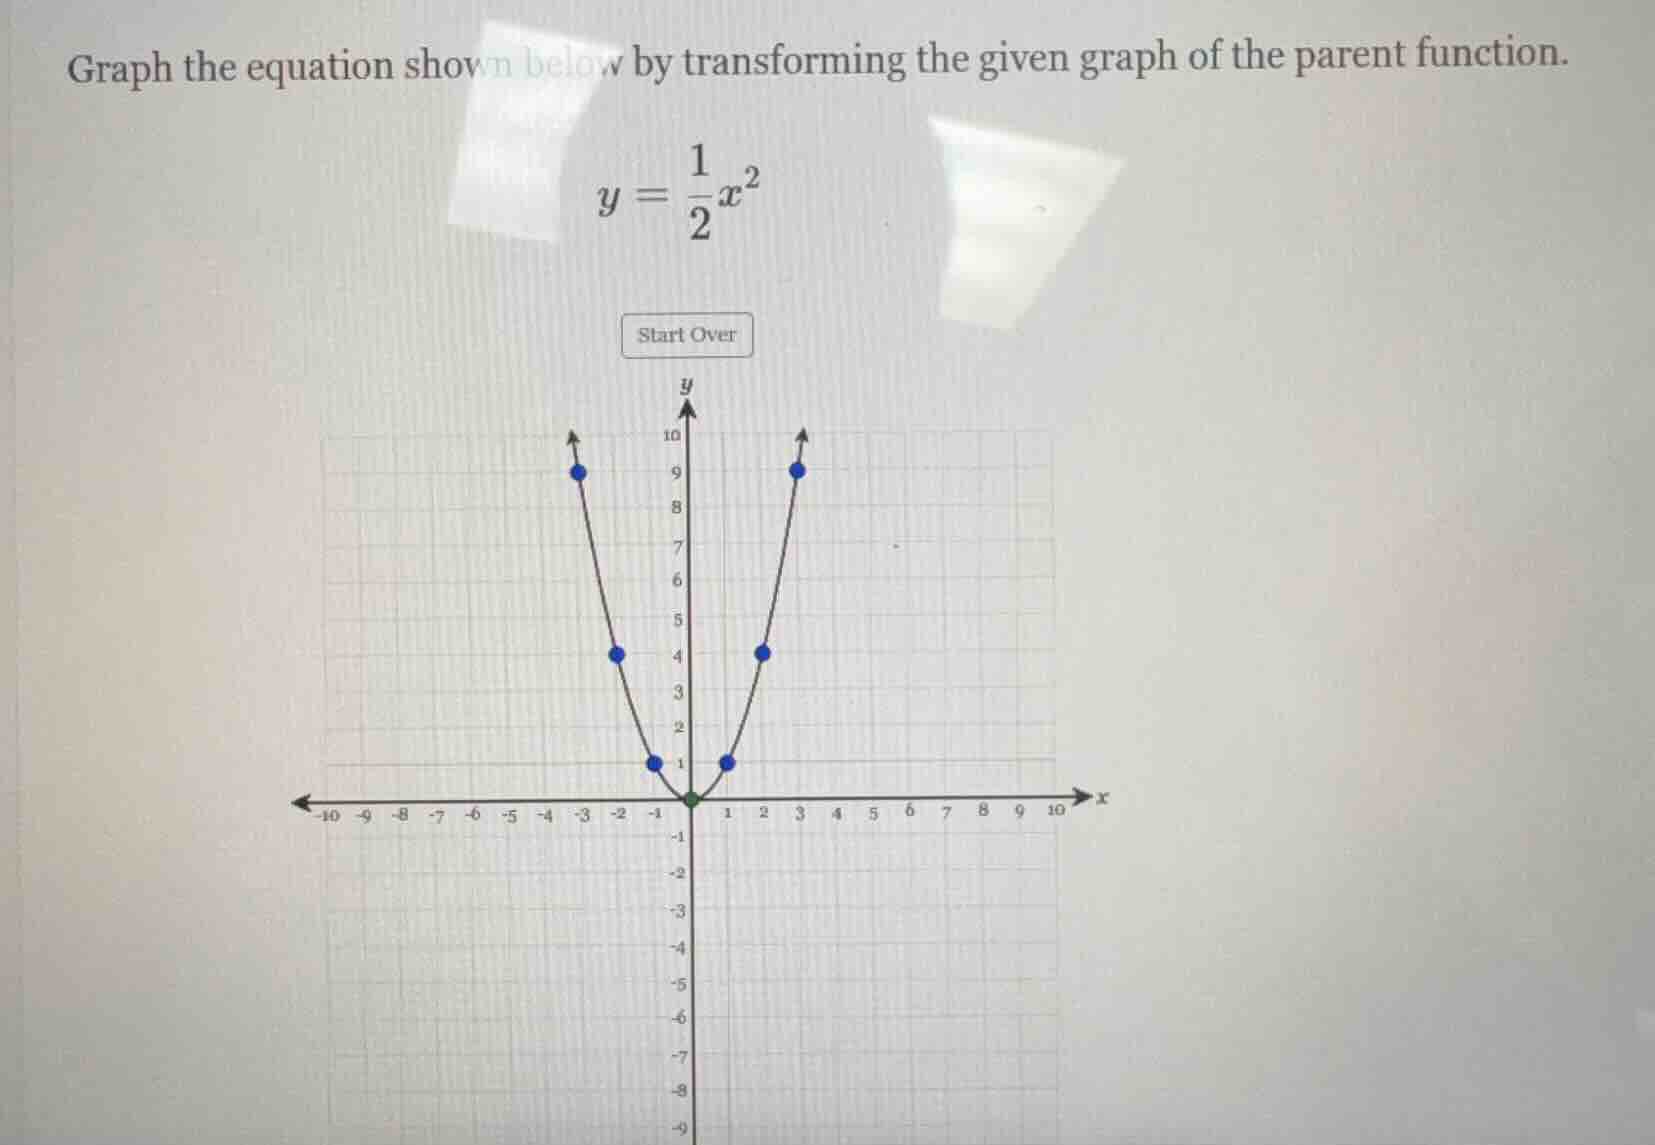
graph the equation shown below by transforming the given graph of the parent function.
$y = \frac{1}{2}x^2$
Step1: Identify the parent function
The parent function for \( y = \frac{1}{2}x^2 \) is \( y = x^2 \), which is a parabola opening upwards with vertex at the origin \((0,0)\) and a standard "width" (for \( x = \pm1 \), \( y = 1 \); for \( x=\pm2 \), \( y = 4 \); for \( x=\pm3 \), \( y = 9 \), etc.).
Step2: Analyze the transformation (vertical compression)
The equation \( y=\frac{1}{2}x^2 \) represents a vertical compression of the parent function \( y = x^2 \) by a factor of \( \frac{1}{2} \). A vertical compression by a factor of \( a \) (where \( 0 < a < 1 \)) means that for each \( x \)-value, the corresponding \( y \)-value of the transformed function is \( a \) times the \( y \)-value of the parent function.
For example:
- When \( x = \pm1 \): Parent function \( y = 1^2=1 \), Transformed function \( y=\frac{1}{2}(1)^2=\frac{1}{2} \approx 0.5 \) (but in the given graph, the parent - like graph has points at \( x=\pm1,y = 1 \); for our transformed graph, these points should be at \( y=\frac{1}{2}\times1 = 0.5 \), but maybe the original graph is a scaled - up version for illustration. Wait, actually, looking at the given graph, the points on the parent - like graph (probably \( y = x^2 \) scaled? No, wait, the given graph has points like \( x=\pm1,y = 1 \), \( x=\pm2,y = 4 \), \( x=\pm3,y = 9 \). For our function \( y=\frac{1}{2}x^2 \):
- When \( x=\pm1 \), \( y=\frac{1}{2}(1)^2=\frac{1}{2} \)
- When \( x = \pm2 \), \( y=\frac{1}{2}(2)^2=\frac{1}{2}\times4 = 2 \)
- When \( x=\pm3 \), \( y=\frac{1}{2}(3)^2=\frac{1}{2}\times9 = 4.5 \)
To graph \( y=\frac{1}{2}x^2 \) from the parent graph \( y = x^2 \):
- Take the key points of the parent function \( y=x^2 \): \((- 3,9)\), \((-2,4)\), \((-1,1)\), \((0,0)\), \((1,1)\), \((2,4)\), \((3,9)\)
- Apply the vertical compression: Multiply each \( y \)-coordinate by \( \frac{1}{2} \). So the new points are \((-3,4.5)\), \((-2,2)\), \((-1,0.5)\), \((0,0)\), \((1,0.5)\), \((2,2)\), \((3,4.5)\)
Then, plot these new points and draw a smooth parabola through them, which will be wider (vertically compressed) than the parent function \( y = x^2 \).

Snap & solve any problem in the app
Get step-by-step solutions on Sovi AI
Photo-based solutions with guided steps
Explore more problems and detailed explanations
To graph \( y=\frac{1}{2}x^2 \):
- Start with the parent function \( y = x^2 \) (a parabola opening up, vertex at \((0,0)\)).
- Vertically compress the parent function by a factor of \( \frac{1}{2} \): For each point \((x,y)\) on \( y = x^2 \), the corresponding point on \( y=\frac{1}{2}x^2 \) is \((x,\frac{1}{2}y)\).
- Plot key points like \((-3,4.5)\), \((-2,2)\), \((-1,0.5)\), \((0,0)\), \((1,0.5)\), \((2,2)\), \((3,4.5)\) and draw a smooth parabola through them. The resulting parabola will be wider (vertically compressed) than the parabola of \( y = x^2 \).