QUESTION IMAGE
Question
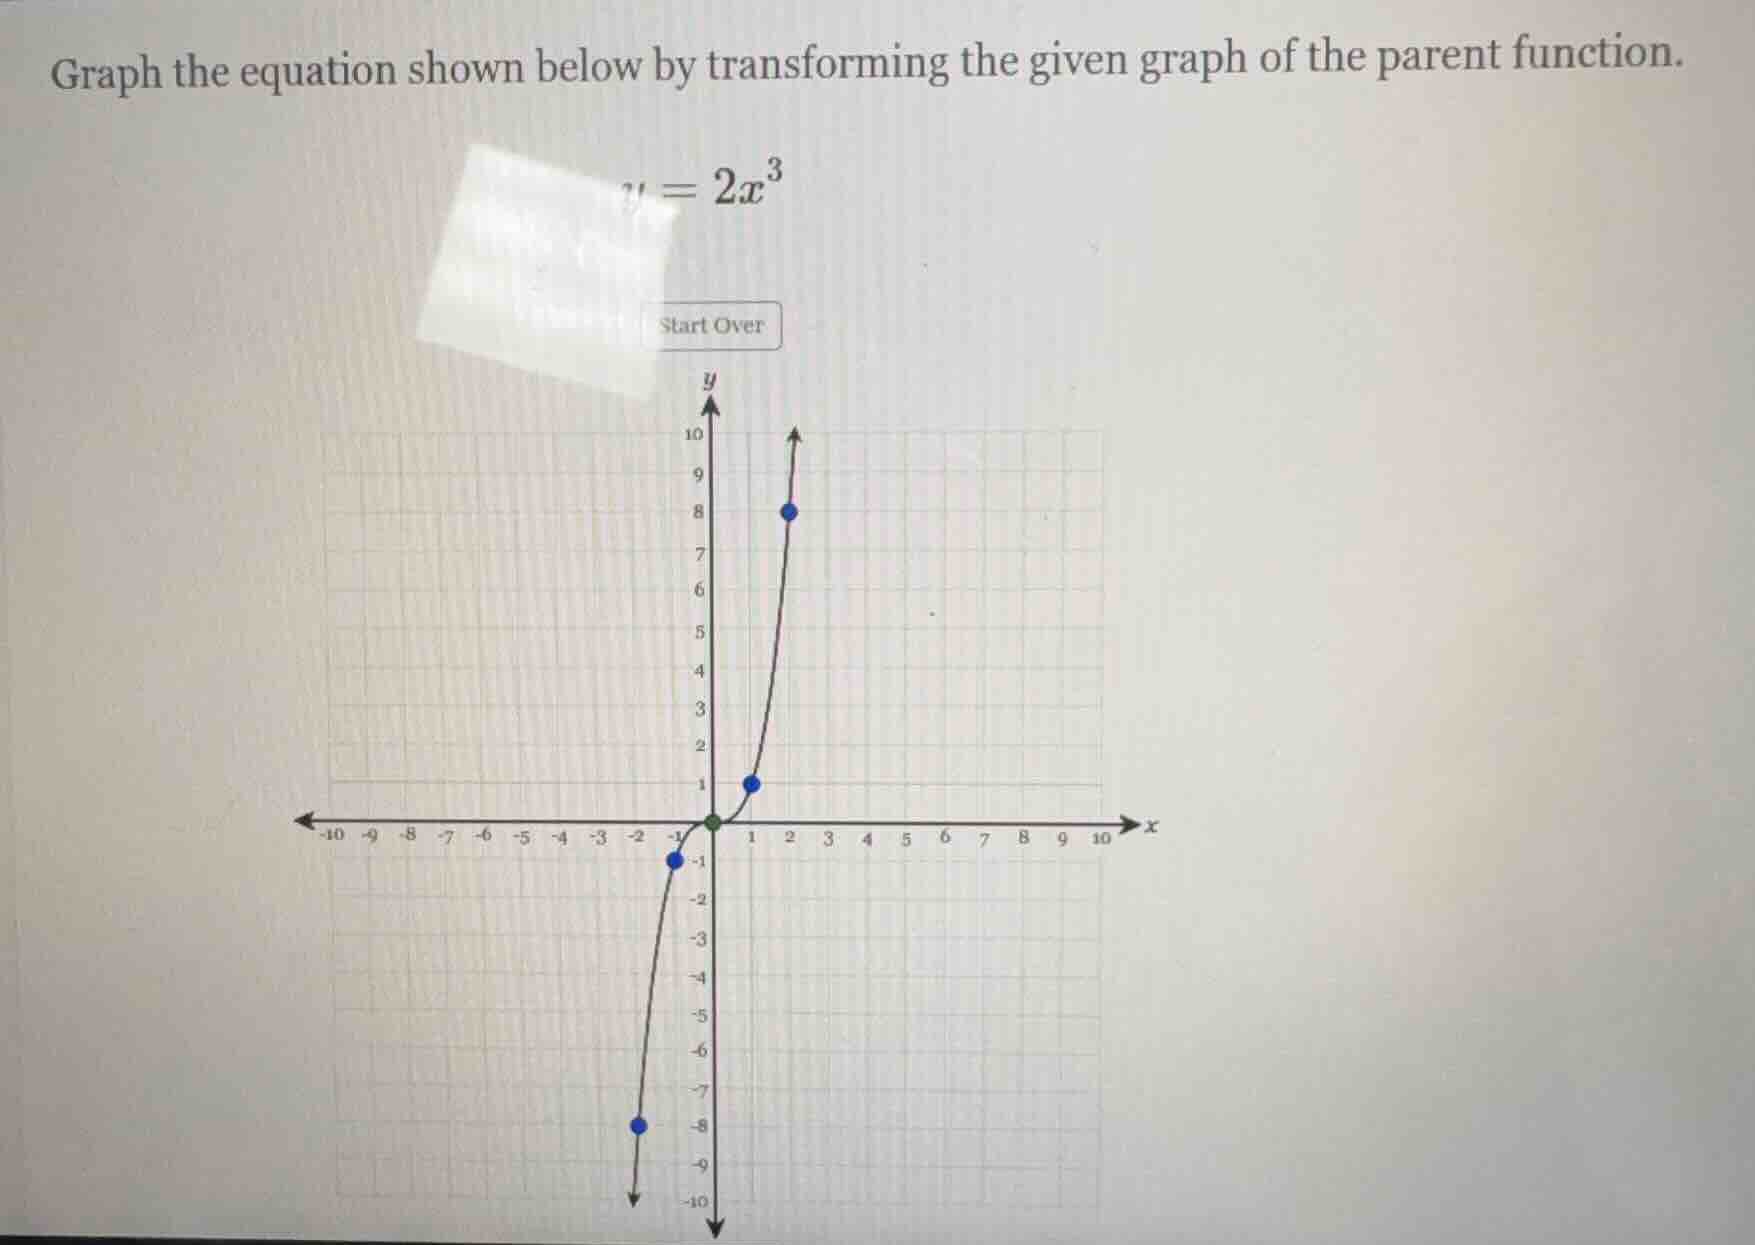
graph the equation shown below by transforming the given graph of the parent function.
y = 2x³
Step1: Identify the parent function
The parent function for \( y = 2x^3 \) is \( y = x^3 \). The graph of \( y = x^3 \) is a cubic curve passing through the origin, symmetric about the origin, with a point at \( (1,1) \), \( (-1,-1) \), \( (2,8) \), \( (-2,-8) \) etc.
Step2: Analyze the transformation
The given function is \( y = 2x^3 \), which is a vertical stretch of the parent function \( y = x^3 \) by a factor of 2. For a vertical stretch by a factor \( a \) (where \( a>1 \)), the transformation rule is: if \( y = f(x) \) is the parent function, then \( y = a\cdot f(x) \) vertically stretches the graph by a factor of \( a \). So, for each \( x \)-value, the \( y \)-value of the parent function \( y = x^3 \) is multiplied by 2.
- For \( x = 1 \): Parent function \( y = 1^3=1 \), transformed function \( y = 2\times1 = 2 \)? Wait, no, wait the graph in the image has a point at \( (1,1) \)? Wait, no, maybe the parent function in the graph is \( y = x^3 \), and we need to transform it to \( y = 2x^3 \). Let's check the points:
- For \( x = 1 \): Parent \( y = 1^3 = 1 \), transformed \( y = 2\times1^3 = 2 \)? But the given graph has a blue dot at \( (1,1) \), maybe the parent graph is \( y = x^3 \), and we need to stretch it vertically by 2. So the new points will be:
- At \( x = -2 \): Parent \( y = (-2)^3=-8 \), transformed \( y = 2\times(-8)=-16 \)? Wait, no, the graph in the image has a blue dot at \( (-2,-8) \)? Wait, the image shows a graph with points: let's list the visible points. The green dot at origin \( (0,0) \), blue dot at \( (1,1) \), \( (2,8) \), \( (-1,-1) \), \( (-2,-8) \). Wait, that's the graph of \( y = x^3 \). So to graph \( y = 2x^3 \), we need to take each point \( (x,y) \) on \( y = x^3 \) and transform it to \( (x, 2y) \).
- For \( x = 1 \): Original \( y = 1 \), new \( y = 2\times1 = 2 \).
- For \( x = 2 \): Original \( y = 8 \), new \( y = 2\times8 = 16 \)? But the graph in the image has a blue dot at \( (2,8) \), so maybe the parent graph is \( y = x^3 \), and we need to stretch it vertically by 2. So the transformation is:
- Take the parent graph \( y = x^3 \) (with points like \( (-2,-8) \), \( (-1,-1) \), \( (0,0) \), \( (1,1) \), \( (2,8) \)) and multiply each \( y \)-coordinate by 2. So the new points will be:
- \( (-2, 2\times(-8)) = (-2, -16) \)? Wait, no, that can't be. Wait, maybe I misread the graph. Wait the given graph in the image: let's check the y-axis. The y-axis has marks from -10 to 10. The blue dot at \( (2,8) \), \( (1,1) \), \( (-1,-1) \), \( (-2,-8) \). So that's \( y = x^3 \). Now, the function to graph is \( y = 2x^3 \), so for each \( x \), \( y \) is doubled. So:
- At \( x = 1 \): \( y = 2\times1^3 = 2 \)
- At \( x = 2 \): \( y = 2\times2^3 = 16 \) (but 16 is above the y-axis limit of 10? Wait, maybe the graphing tool has a grid, and we need to plot the transformed points. So the steps to graph are:
- Start with the parent function \( y = x^3 \), which has key points \( (-2, -8) \), \( (-1, -1) \), \( (0, 0) \), \( (1, 1) \), \( (2, 8) \).
- Apply the vertical stretch by factor 2: multiply each y-coordinate by 2. So the new key points are:
- \( (-2, 2\times(-8)) = (-2, -16) \) (but maybe the graphing tool will show the relative stretch)
- \( (-1, 2\times(-1)) = (-1, -2) \)
- \( (0, 2\times0) = (0, 0) \)
- \( (1, 2\times1) = (1, 2) \)
- \( (2, 2\times8) = (2, 16) \)
But since the original graph has points at \( (1,1) \), \( (2,8) \), etc., to transform it, we move each point vertically: for \( (1,1…

Snap & solve any problem in the app
Get step-by-step solutions on Sovi AI
Photo-based solutions with guided steps
Explore more problems and detailed explanations
To graph \( y = 2x^3 \) from the parent function \( y = x^3 \):
- Identify Transformation: \( y = 2x^3 \) is a vertical stretch of \( y = x^3 \) by a factor of 2 (since \( y = 2 \cdot x^3 \), where \( a = 2 > 1 \) for \( y = a \cdot f(x) \)).
- Transform Key Points: For the parent function’s key points \((x, x^3)\) (e.g., \((-2, -8)\), \((-1, -1)\), \((0, 0)\), \((1, 1)\), \((2, 8)\)), multiply the \( y \)-coordinate by 2:
- \((-2, -16)\), \((-1, -2)\), \((0, 0)\), \((1, 2)\), \((2, 16)\).
- Plot and Sketch: Plot these transformed points and draw a smooth cubic curve through them, maintaining the origin symmetry (odd function) and steeper slope than \( y = x^3 \).
(Note: The graph will be vertically stretched, passing through the origin, with \( y \)-values doubled relative to \( y = x^3 \) at each \( x \).)