QUESTION IMAGE
Question
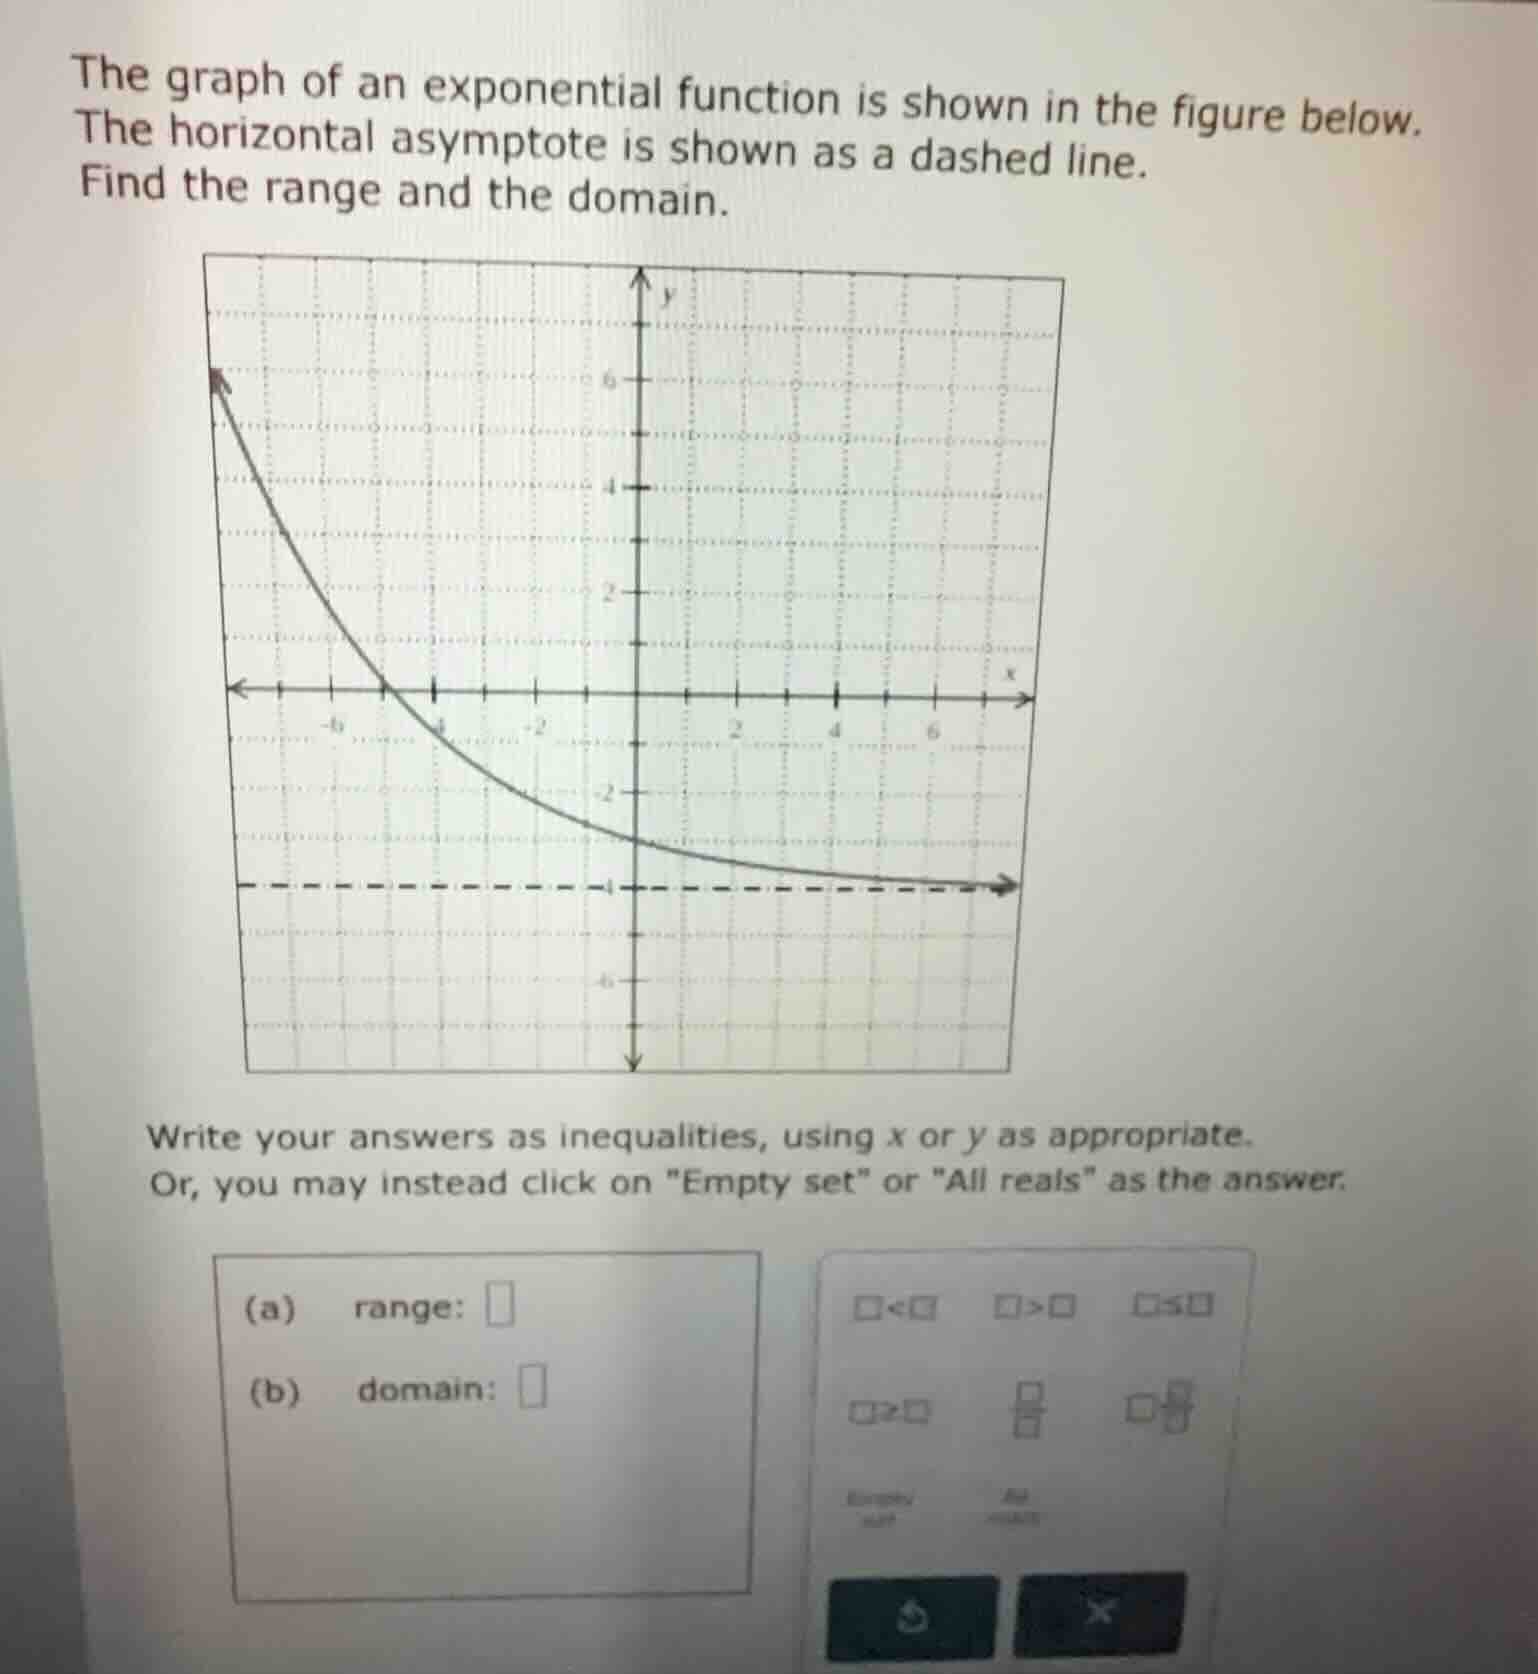
the graph of an exponential function is shown in the figure below. the horizontal asymptote is shown as a dashed line. find the range and the domain. write your answers as inequalities, using x or y as appropriate. or, you may instead click on \empty set\ or \all reals\ as the answer. (a) range: (b) domain:
Step1: Identify the domain
The graph extends infinitely left and right along the x-axis, so all real numbers are valid inputs.
Step2: Identify the range
The horizontal asymptote is $y=-3$, and the graph lies strictly above this line, so $y$ is greater than -3.

Snap & solve any problem in the app
Get step-by-step solutions on Sovi AI
Photo-based solutions with guided steps
Explore more problems and detailed explanations
(a) range: $y > -3$
(b) domain: All reals