QUESTION IMAGE
Question
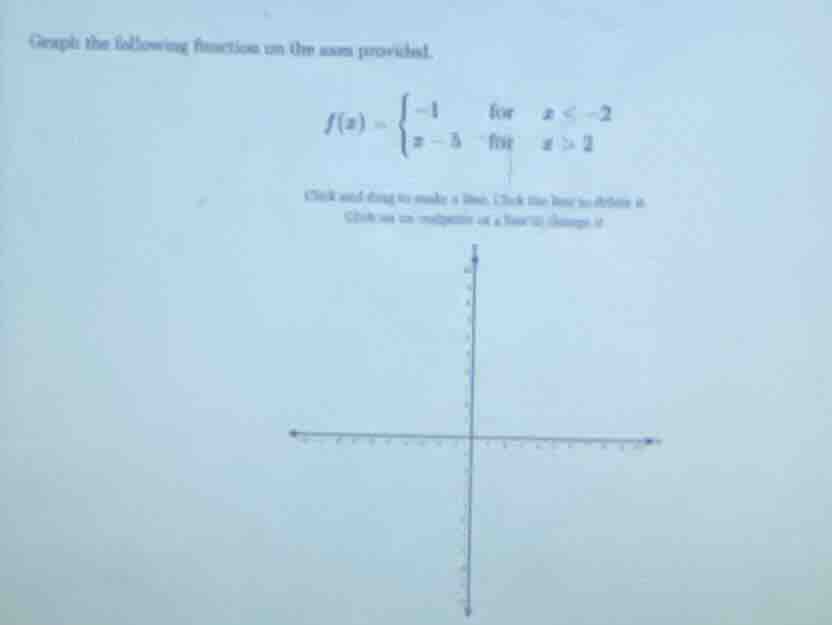
graph the following function on the axes provided.
$f(x) = \
$
click and drag to make a line. click the line to delete it.
click on an endpoint or a line to change it
Step1: Analyze \( f(x) = -1 \) for \( x < -2 \)
This is a horizontal line. For all \( x \) values less than -2, the \( y \)-value is -1. So we can plot a horizontal line starting from the left (as \( x \) approaches -∞) up to \( x = -2 \) (but not including \( x = -2 \), so we use an open circle at \( (-2, -1) \)).
Step2: Analyze \( f(x) = x - 3 \) for \( x \geq 2 \)
This is a linear function with slope 1 and y-intercept -3. First, find the point at \( x = 2 \): \( f(2) = 2 - 3 = -1 \). So we plot a closed circle at \( (2, -1) \). Then, since the slope is 1, for every 1 unit increase in \( x \), \( y \) increases by 1. So we can draw the line starting from \( (2, -1) \) and going to the right (as \( x \) increases).
Graphing Steps (Summary):
- For \( x < -2 \): Draw a horizontal line \( y = -1 \) with an open circle at \( (-2, -1) \).
- For \( x \geq 2 \): Draw the line \( y = x - 3 \) with a closed circle at \( (2, -1) \) and extend it to the right.
(Note: Since this is a text-based explanation, the actual graph would be constructed as described above on the provided axes.)

Snap & solve any problem in the app
Get step-by-step solutions on Sovi AI
Photo-based solutions with guided steps
Explore more problems and detailed explanations
The graph consists of a horizontal line \( y = -1 \) for \( x < -2 \) (open circle at \( (-2, -1) \)) and the line \( y = x - 3 \) for \( x \geq 2 \) (closed circle at \( (2, -1) \)) with slope 1 extending to the right.