QUESTION IMAGE
Question
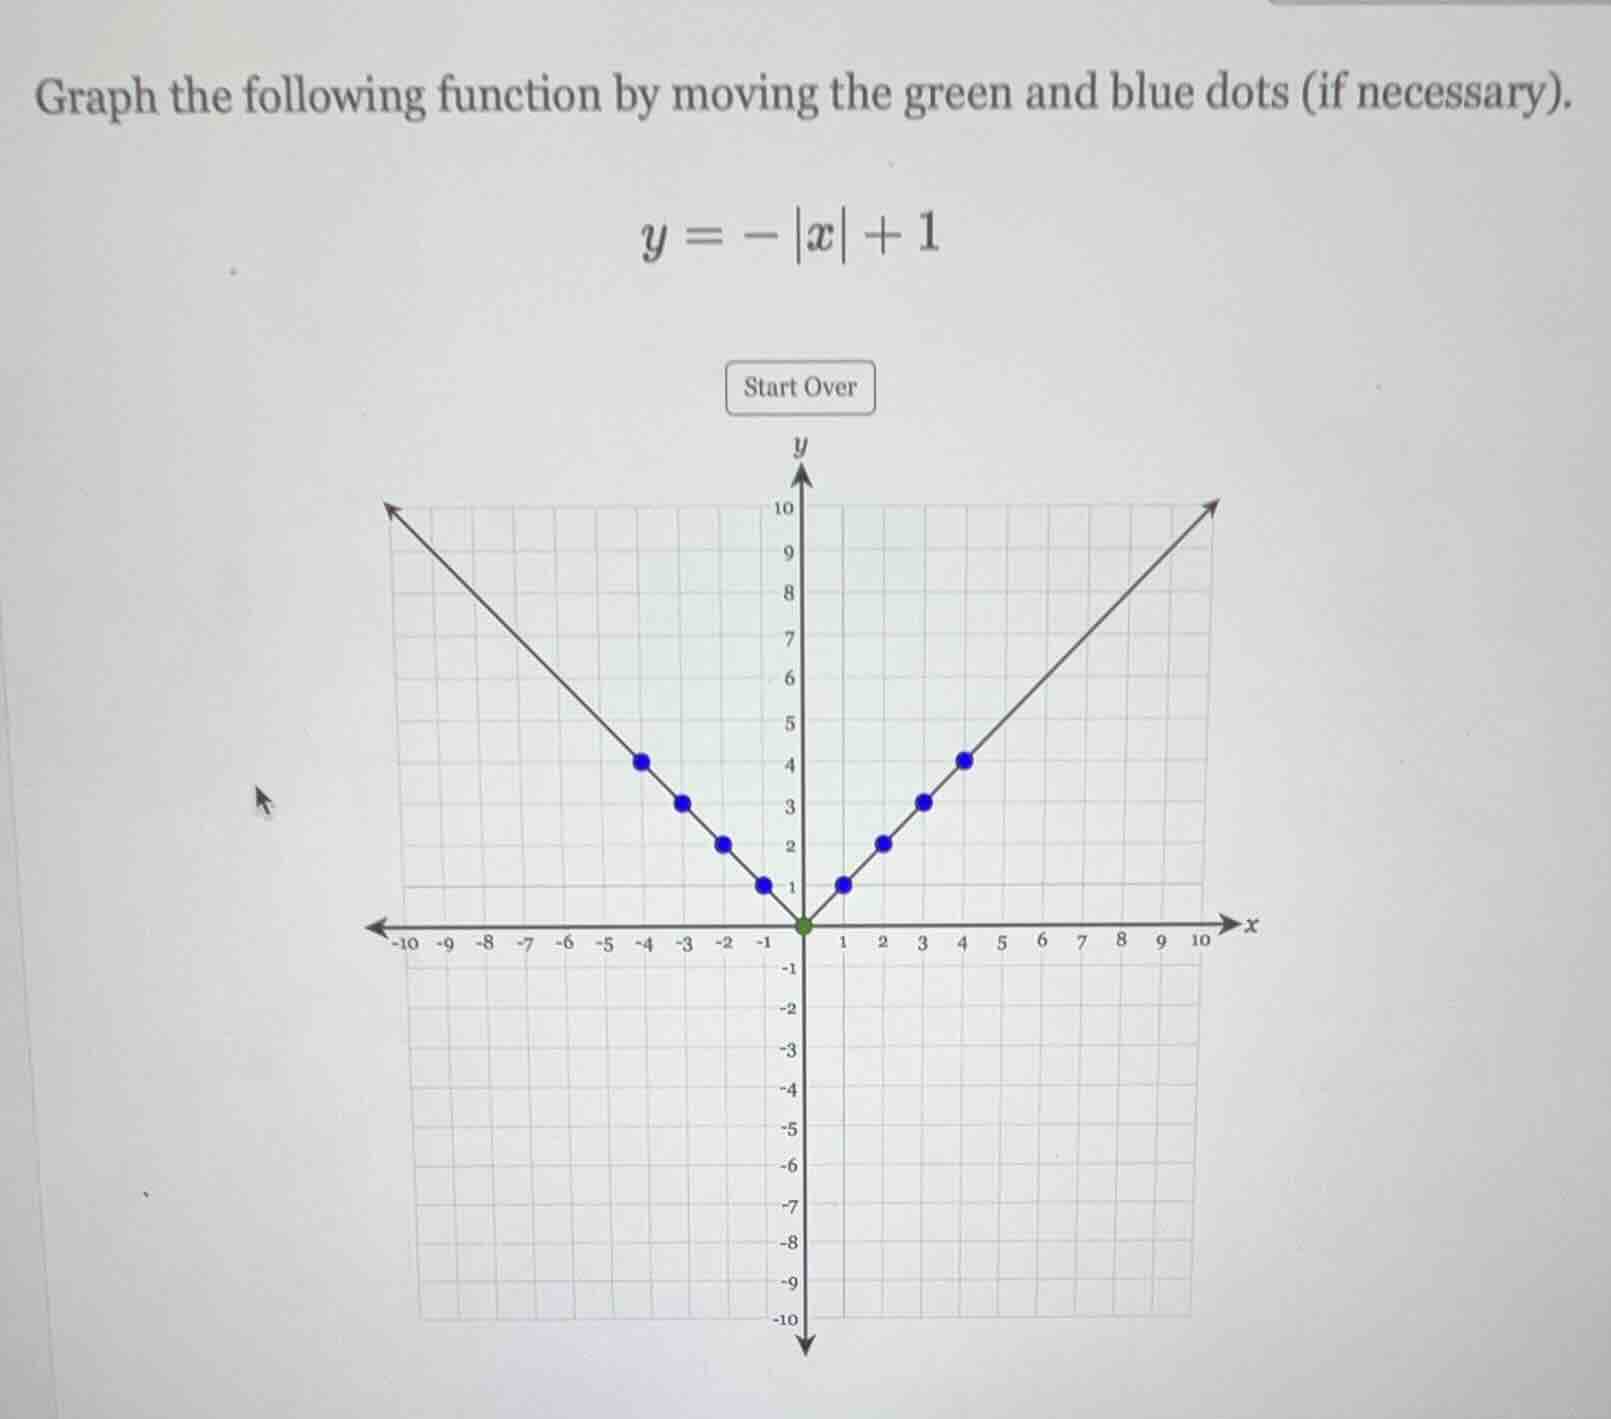
graph the following function by moving the green and blue dots (if necessary).
y = -|x| + 1
Step1: Identify the vertex of the absolute - value function
The general form of an absolute - value function is \(y = a|x - h|+k\), where \((h,k)\) is the vertex. For the function \(y=-\vert x\vert + 1\), we can rewrite it as \(y=-|x - 0|+1\). So, the vertex \((h,k)=(0,1)\). This means the green dot (which represents the vertex) should be moved to the point \((0,1)\) from its current position at \((0,0)\).
Step2: Analyze the slope for \(x\geq0\) and \(x < 0\)
- For \(x\geq0\), the function \(y =-\vert x\vert+1\) simplifies to \(y=-x + 1\). The slope \(m=- 1\) for \(x\geq0\)? Wait, no. Wait, when \(x\geq0\), \(y=-x + 1\), the slope is \(- 1\)? Wait, no, let's correct that. Wait, the parent function of \(y = |x|\) has a slope of \(1\) for \(x\geq0\) and \(- 1\) for \(x<0\). For \(y=-\vert x\vert + 1\), when \(x\geq0\), \(y=-x + 1\), so the slope is \(-1\) for \(x\geq0\)? Wait, no, that's a mistake. Wait, if \(y =-\vert x\vert+1\), when \(x\geq0\), \(y=-x + 1\), so the slope is \(- 1\), and when \(x<0\), \(y=-(-x)+1=x + 1\), so the slope is \(1\) for \(x < 0\).
- Let's find some points:
- When \(x = 0\), \(y=-\vert0\vert + 1=1\) (vertex).
- When \(x = 1\), \(y=-\vert1\vert+1=-1 + 1=0\). So the point \((1,0)\) should be on the graph for \(x\geq0\) part.
- When \(x=-1\), \(y=-\vert - 1\vert+1=-1 + 1=0\). So the point \((-1,0)\) should be on the graph for \(x < 0\) part.
- When \(x = 2\), \(y=-\vert2\vert+1=-2 + 1=-1\).
- When \(x=-2\), \(y=-\vert - 2\vert+1=-2 + 1=-1\).
So for the right - hand side (\(x\geq0\)) of the absolute - value graph (the part where \(x\geq0\)), the line should have a slope of \(-1\) (since \(y=-x + 1\) for \(x\geq0\)), and for the left - hand side (\(x < 0\)), the line should have a slope of \(1\) (since \(y=x + 1\) for \(x < 0\)).
The original blue dots on the right - hand side (for \(x\geq0\)) are following a line with slope \(1\) (from the graph), but we need a slope of \(-1\) for \(x\geq0\) in \(y =-\vert x\vert+1\). Wait, no, let's re - evaluate. Let's take \(x = 1\): \(y=-\vert1\vert + 1=0\), so the point \((1,0)\) should be on the graph. For \(x = 2\), \(y=-\vert2\vert+1=-1\), so the point \((2,-1)\) should be on the graph. For \(x = 3\), \(y=-\vert3\vert+1=-2\), and so on. For the left - hand side, when \(x=-1\), \(y = 0\), \(x=-2\), \(y=-\vert - 2\vert+1=-1\)? Wait, no, \(y=-\vert - 2\vert+1=-2 + 1=-1\)? Wait, no, \(y=-\vert - 2\vert+1=-2 + 1=-1\)? Wait, no, \(\vert - 2\vert=2\), so \(y=-2 + 1=-1\). So the point \((-2,-1)\) should be on the graph.
So the correct graph of \(y =-\vert x\vert+1\) has its vertex at \((0,1)\), and for \(x\geq0\), it's a line with slope \(-1\) (passing through \((0,1)\), \((1,0)\), \((2,-1)\), etc.), and for \(x < 0\), it's a line with slope \(1\) (passing through \((0,1)\), \((-1,0)\), \((-2,-1)\), etc.).
So to graph the function:
- Move the green dot (vertex) to \((0,1)\).
- For the right - hand side ( \(x\geq0\) ), the blue dots should be adjusted. For example, when \(x = 1\), \(y = 0\) (so the dot at \((1,1)\) should be moved to \((1,0)\)), when \(x = 2\), \(y=-1\) (the dot at \((2,2)\) should be moved to \((2,-1)\)), etc.
- For the left - hand side ( \(x < 0\) ), when \(x=-1\), \(y = 0\) (the dot at \((-1,1)\) should be moved to \((-1,0)\)), when \(x=-2\), \(y=-1\) (the dot at \((-2,2)\) should be moved to \((-2,-1)\)), etc.

Snap & solve any problem in the app
Get step-by-step solutions on Sovi AI
Photo-based solutions with guided steps
Explore more problems and detailed explanations
To graph \(y =-\vert x\vert+1\):
- Move the green vertex dot to \((0,1)\).
- For \(x\geq0\), the line has a slope of \(- 1\) (passes through points like \((1,0)\), \((2,-1)\), etc.).
- For \(x < 0\), the line has a slope of \(1\) (passes through points like \((-1,0)\), \((-2,-1)\), etc.). The final graph will be a "V - shaped" graph opening downward with vertex at \((0,1)\), passing through \((1,0)\), \((-1,0)\), \((2,-1)\), \((-2,-1)\) and so on.